Week three at the Data School was dedicated to Alteryx training and in just a few days we were introduced to topics ranging all the way from data blending to predictive analytics.
On day three Paul Houghton took us through an exercise taking freely available JSON data from Quandle and transforming this to a Tableau output in Alteryx. Our task for the Friday presentations was to find a similar dataset online and recreate the process.I chose a website closer to my interests and scanned the WHO pages for available datasets, where I found the “Median availability of selected generic medicines data by country” and decided that this, with its two columns and limited rows, would be a good practice exercise. This simplicity turned out to be somewhat deceptive but it did provided lots of practice.

To process this data in Alteryx the first steps were to (1) link to the json URL, (2) use the download tool to import this data and then (3) transform this information with the json parse tool.
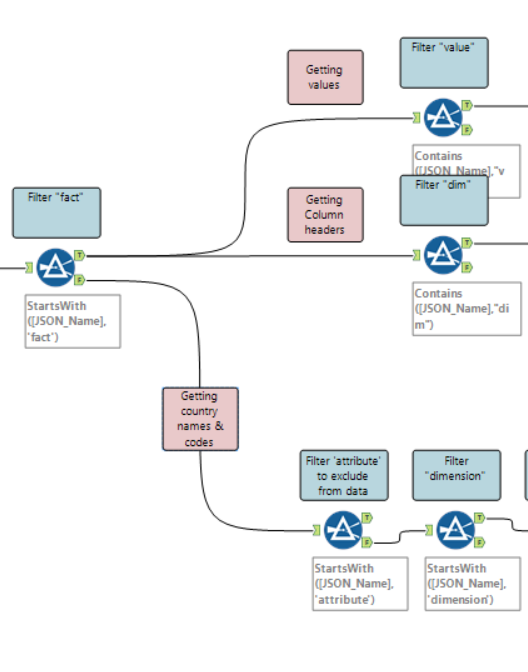
In the next step it became clear that the dataset was more complicated than I had expected and that there were multiple levels of information nested in each other. I used several filters to separate the json name to end up with three workflow streams, each of which processed a different part of the data. Once I had isolated the part of the data that I needed through a filter I then split the json name into several rows, which in the case of the last stream then had to be filtered further.

Once the information was separated out, I used the cross tab tool to get the data into its designated place. This gave me lots of practice using this tool, which now makes a lot more sense to me.
- “Group data by these values” – This is the column (or columns) that will remain where it is currently. For example that was the Record ID, by which each country could be identified.
- “New column headers” – This will form the new column headers. In this example, there were five different values in this column, which were rearranged to become the headers for the values specified in step 3.
- “Values for new columns” – This is the column that currently contains the data values and will be rearranged according to the previous two settings.
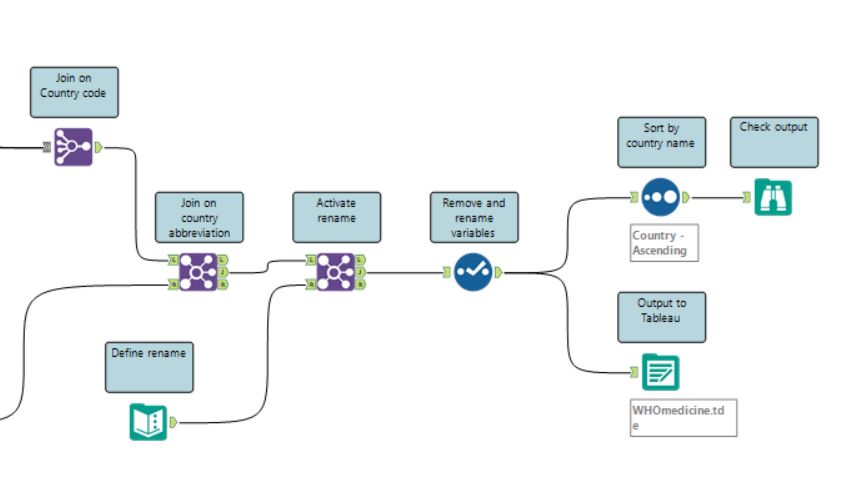
In the following steps I joined the streams back in to one and cleaned up some of the duplicate variables and did some renaming.
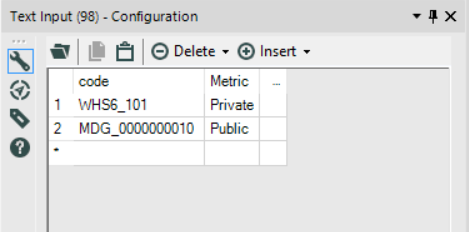
Rather than ‘public’ and ‘private’ as they are called in the example on the website, the values in this column were unhelpfully named ‘WHS6_101’ and ‘MDG_0000000010’. One way of renaming these is by adding a text input tool and specifying the current label and the desired label, then joining them to the dataset by the original label. This creates a new column with the new labels. The original column was then excluded through a select tool, along with others that weren’t needed.


To complete the workflow, I included a sort and browse to check my data against the original and created the output to Tableau.
