For this mini-series on parameters I would like to start with one that I used for the client project last week. Amanda and I were working on two dashboards that presented a large amount of data at a detailed level. We designed a twin lollipop chart that would give an overview of the data while still showing detailed information about each individual case in a table to the left of it.
The left side showed the total numbers of companies in that category, while the right side showed the percentage of market penetration. These values on the right were typically lower than 15%, with one outlier that had a value of 100%. This case was valid and potentially useful to the customer so we decided we could not exclude it from the data. However, it made it difficult to visually assess the relationship between the other cases.
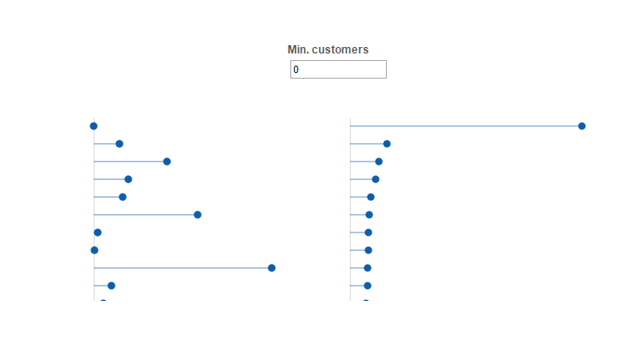
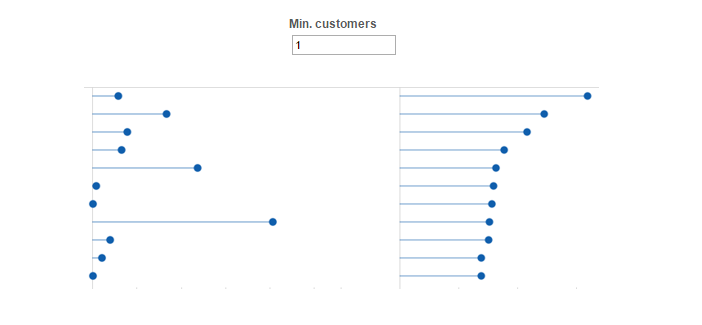
To solve this problem, we created a parameter that allowed the dashboard user to decide what the minimum number of companies had to be for a case to be displayed. By changing this filter from 0 to 1 the outlier was excluded and comparisons between smaller values made possible. By choosing higher numbers the user could also exclude cases with smaller numbers of companies as these were potentially less important for decision-making.
.
This dashboard filter can be created with the following steps:
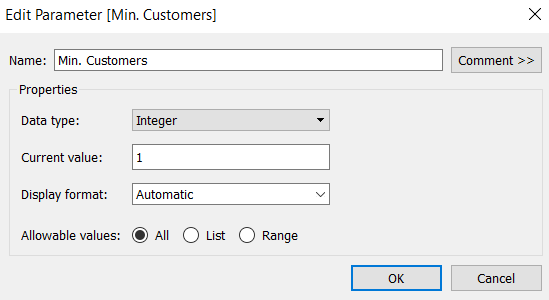
- Create a new parameter and give it a name. Set the data type to ‘Integer’, the value it should start on, and set the display format to ‘Automatic’. In our case all values were allowable, so the user has the freedom to input any threshold they feel is relevant.
- Create a new calculation.
- [Variable that should be filtered] > [Parameter name]
- The first part of the calculation refers to the variable that will be altered, in our case that was the total number of customers for each case.
- The second part of the calculation refers to the parameter that was just created. In our case this was ‘Min. Customers’
- So our calculation was: [customers] > [Min. Customers]
- This is a Boolean calculation that results in a true statement if the number of customers in the case is larger than what the user has defined in the parameter.
- On the worksheet that this parameter will be applied to, drag the calculation that was just created to the filters shelf and select only ‘T’
- This means that only those values will be displayed that meet the conditions set out in the calculation. In our case, only those that are larger than the number entered by the user in the parameter.
- In the data view, find your parameter and click the downwards pointing arrow in order to pull up the options for this pill. Select ‘Show parameter control’, which will add it to the worksheet and allow the user to interact with it.
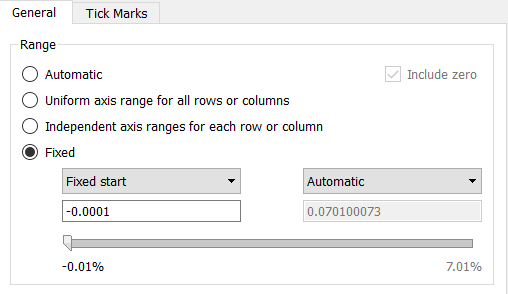
- Finally, we also had to edit our axis, so that it started at a fixed point but would change automatically to show the full range of values once the highest had been removed.
- We had to set the starting point to a value below zero in order for the zero line to always be shown
.