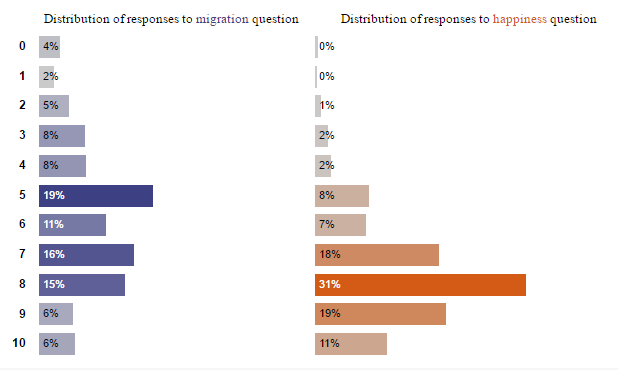
When putting together a dashboard it can sometimes be helpful to include charts and/or headers separately. This extract from the remake of my DS application actually consists of three seperate worksheets that have been set aside each other in the final dashboard, one for the header and two for the bar charts. This can help with formatting issues. For instance, making the two bar charts separetely was a lot easier than trying to make them in the same worksheet. Equally, having the header row in a separate sheet can give you more freedom over placement and formatting.
This will only work of course if your charts do not require scrolling. You will also usually want to make sure that your axes are fixed. So in the example below, both charts are fixed at a maximum of 45%. This makes the bars comparable. If I hadn’t done that, the 19% bar on the blue bar chart would look similar to the 31% bar on the orange chart and this would be misleading. Finally, the formatting might look great while still in Tableau Desktop, but you will need to check if everything still aligns once uploaded to Server or Public and possibly make some adjustments.

