For the second day of dashboard week, we were tasked with analyzing the data from the National Survey of College Graduates 2021, with the free reign to tackle this in any way we wanted. As soon as I saw the topic for the day, I knew exactly how I wanted to go about this dashboard – I wanted my dashboard to highlight the racial inequities that exist in the United States education system, specifically in regards to college and employment attainment. There’s power in data, and unfortunately this topic is so prevalent in our society, but is lacking the attention it needs. Similar to my dashboard on Bias In Police Violence in the United States, I wanted to create a dashboard that highlights the inequities and social barriers that affect many people in the job and college world.
Some of the questions my dashboard will answer are:
- What is the current racial disparity in college graduation rates across different racial and ethnic groups?
- Are there disparities in post college outcomes, such as employment rates and income levels, between different racial and ethnic groups?
- How have racial disparities in college graduation rates and job attainment changed over time?
These are some questions that I have thought of but unfortunately will not be able to implement in this dashboard:
- Have there been any initiatives implemented to address and reduce racial disparities in college graduation rates? If so, what have been their outcomes?
- How do socioeconomic factors intersect with race to influence college graduation rates?
- What strategies have been successful in closing he racial gap in college attainment?
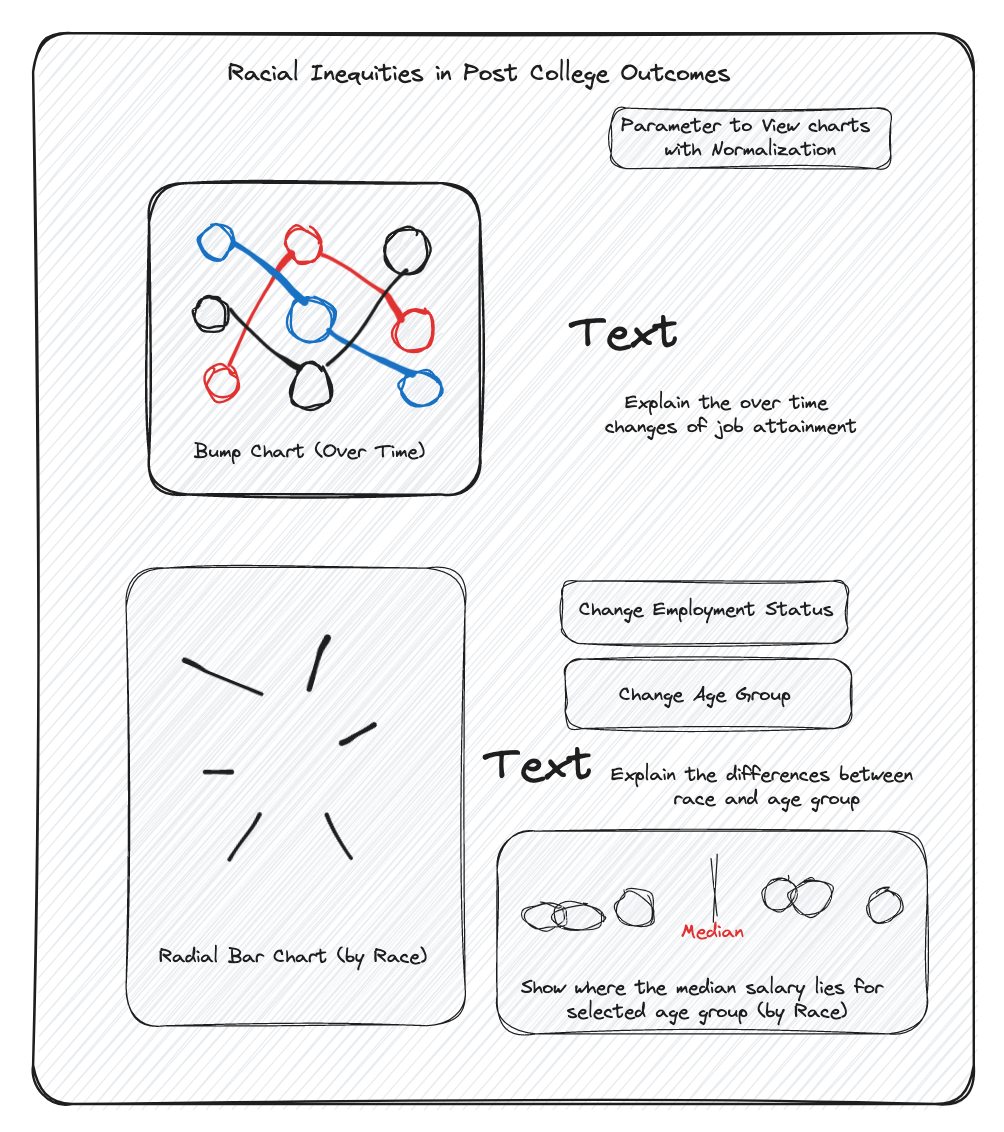
The dashboard Template I will attempt to implement in the time allotted: