For the third day of dashboard week we were tasked with web scraping the Bundesliga website and creating an exploratory dashboard that would allow users to learn more about Bundesliga teams and seasons (using at least 20 seasons).
When I saw that the task asked for multiple seasons to be web scraped, I knew it would be best to build a batch macro that would run the same web scraping process based on an inputted list of seasons.
With this concept in mind, I built a workflow that would not only web scrape a season, but also perform the cleaning process that needed to be done using many RegEx tools. After creating this workflow, I transformed it to a batch macro by placing a control parameter over the URL link and applied it to affect the season part of the URL, i.e., change the “2021-2022” from the link: https://www.bundesliga.com/en/bundesliga/table/2021-2022 (so that I can web scrape the 20+ seasons that I needed).
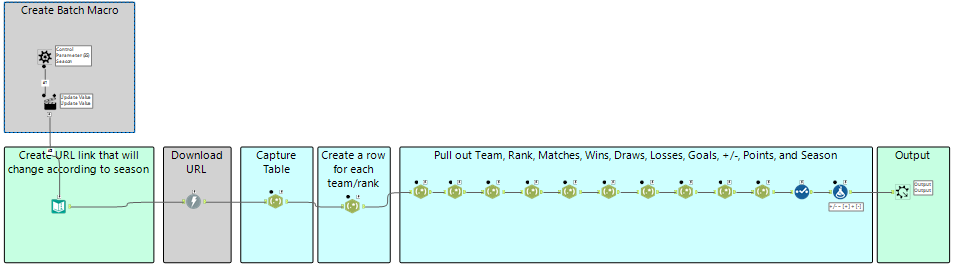
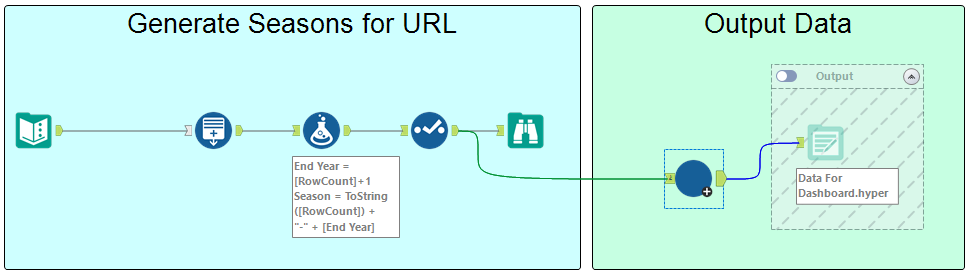
After finishing the macro, I opened a new workflow to generate the years I wanted my dashboard to explore. With these seasons (or rather years) created, I brought in my batch macro and viola! I had all the data I needed to create my dashboard.
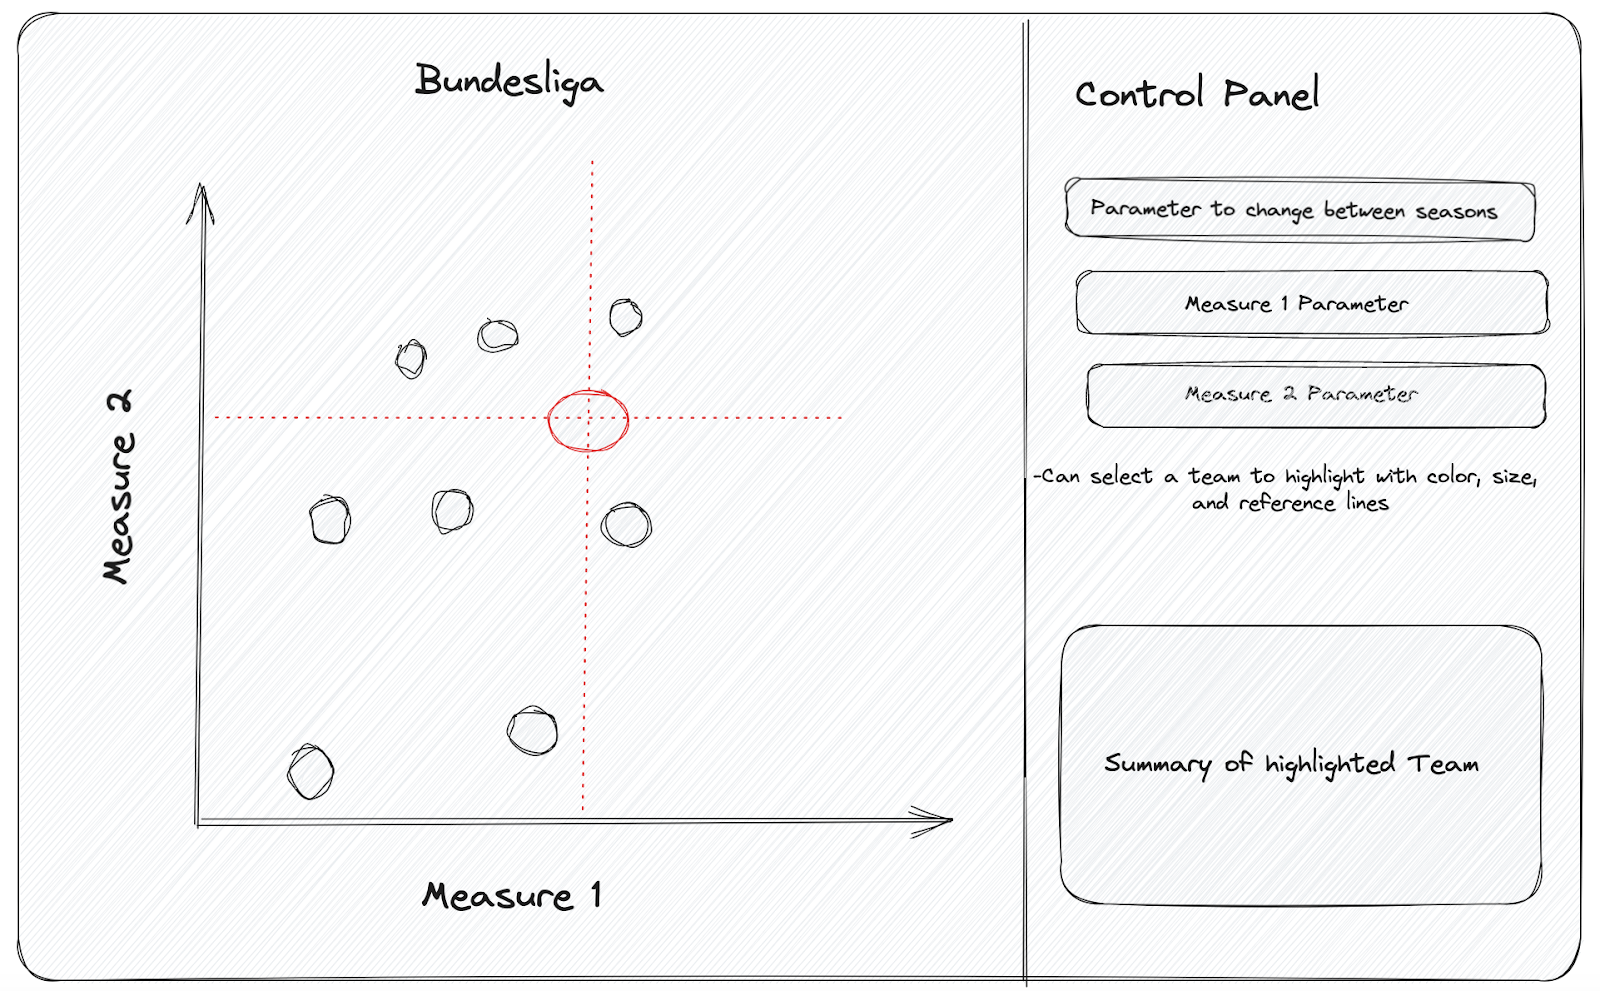
After exploring the dataset, I decided to conceptualize a dashboard design based on a scatterplot that would allow users to select whatever measures they would want to explore on the axes. I also wanted them to have the ability to switch between seasons and select a team they would like to highlight and explore further.