A guide to creating a chart that allows you to view the sales of any selected month, and the previous month's sales.
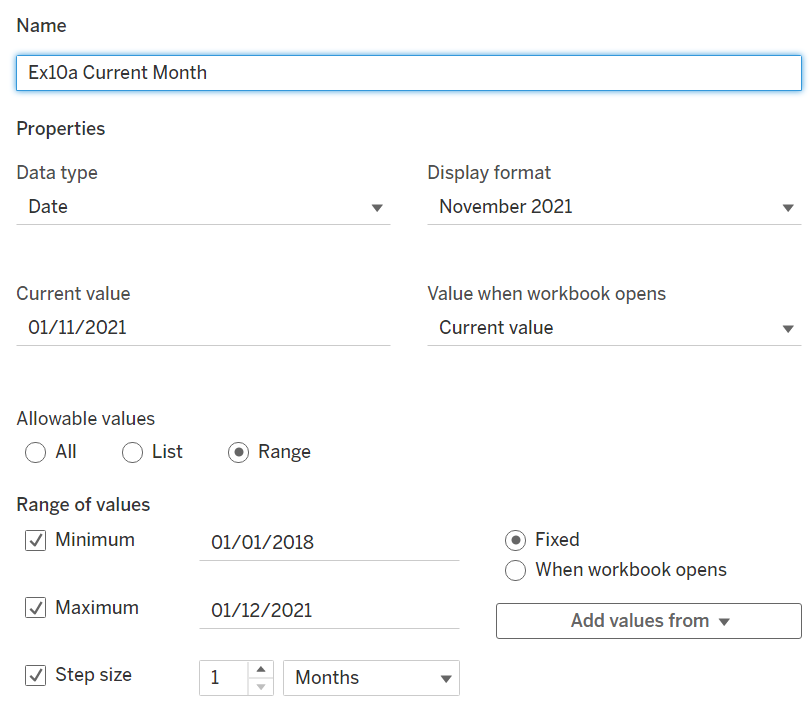
- Create a Parameter called 'Current Month'. Change the data type to 'Date' and set the allowable values to 'Range'. Make sure to select the 1st of the month for the day part of the minimum and maximum range. Show the Parameter and have it set as a slider.
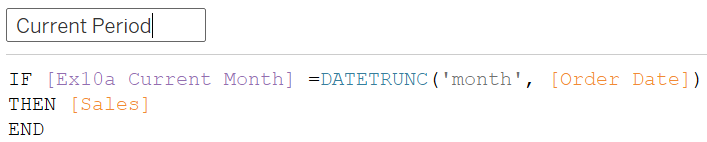
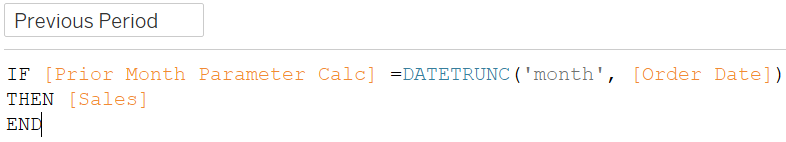
2. Next, create the 1st calculated field that is required. This will show the sales of the current month. To explain what this is showing, it is stating: if the month the parameter is set at, equals the datetrunc version of the order date then show that months' sales.
-The DATETRUNC function returns the value of the order date's month.
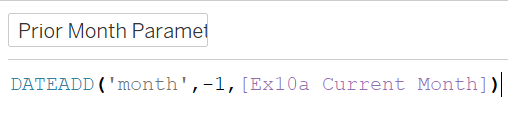
3. Before we duplicate the calculation to create the previous month sales, another calculated fields needs to be created to subtract1 from the month the parameter slider is set on. Simple adding a '-1' after the parameter in the calculated field will not work as this would subtract 1 day from within the month, as opposed to subtracting the whole month.
4. Now we can duplicate the 'Current Period' calculation. Rename it and edit the parameter - the parameter needs to be replaced with the parameter calculation we just created.
5. Once the 2 calculations have been created, drag them both to the 'Columns' shelf. As this creates 2 separate axis, right-click on the SUM(Previous Period) calculation and select 'Dual Axis'. Don't forget to synchronise the axes! This is done by right-clicking on the top axis and selecting 'Synchronise Axis'.
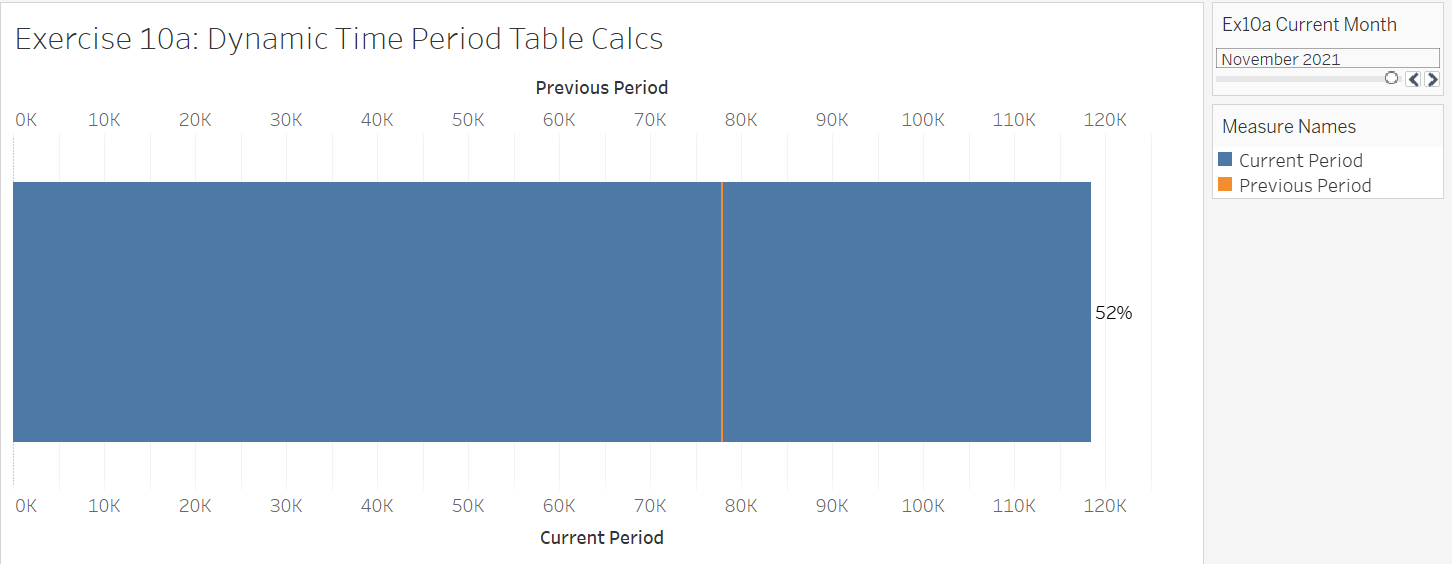
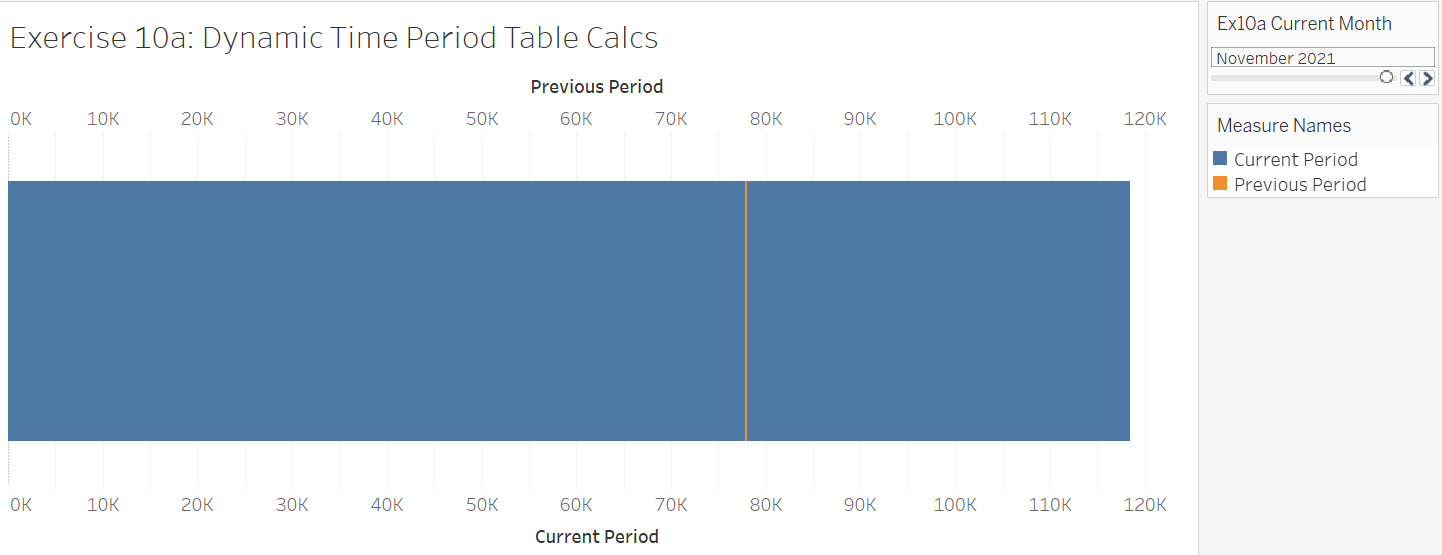
6. Moving on to the marks cards, change the 'Current Period' marks card to Bar and the 'Previous Period' marks card to a Gantt bar. The chart should look like this.
7. To display the % change between the current and previous month, create another calculated field and name it % Difference. The calculation for the % change = (current month-previous month)/previous month. Each measure value must be wrapped in SUM(ZN()) for the calculation to work (ZN stands for zero null and it equates null values with a 0).

8. Drag the new calculation to the Label tile in the 'Current Period' marks card to show the mark labels. To show the %, right-click the label and select format. Select the AGG % difference measure from the 'Fields' dropdown - this is to specifically format the label of the % change calculation.
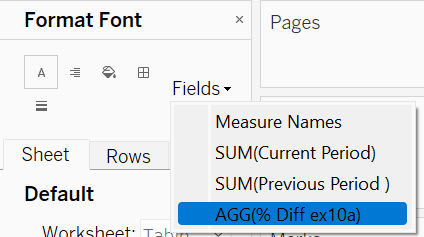
Then, under the 'Default' section, you can change the number to a percentage and select the number of decimal places you would like. For this example we did 0 decimal places.
Below is the final view of the chart we created.