


Today’s blog show you how to create an advanced pie chart – sunburst donut chart using Map Layer. This way you do not need to work with floating element on your dashboard and you need only one worksheet.
I have learned a lot about map layer from a video of Luke Stanke, and I will explain the How-to step-by-step here, plus extra formarting to make the chart look nicer.
APPROACH
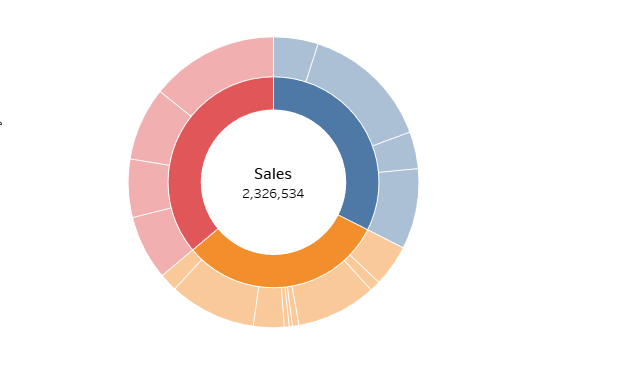
There are three layers in the example chart (using Superstore data) in the order from outside to inside, or behind to front:
1.Sub-Category (expanded from Category)
2. Category (main donut chart)
3. Blank circle
Each layer is a circle (pie chart) laying on one layer of the map, they have the same coordinate, so that they centre at one point. You can work in the marks card to change the size and add other details into it.
If you used to make donut chart using dual-axis, this way is much easier, faster, and you can add how many layers as you wish!
THE STEPS
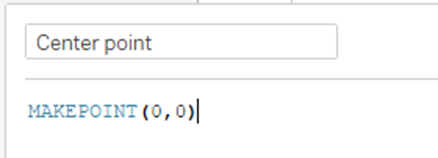
1.Create a calculation field for the center point
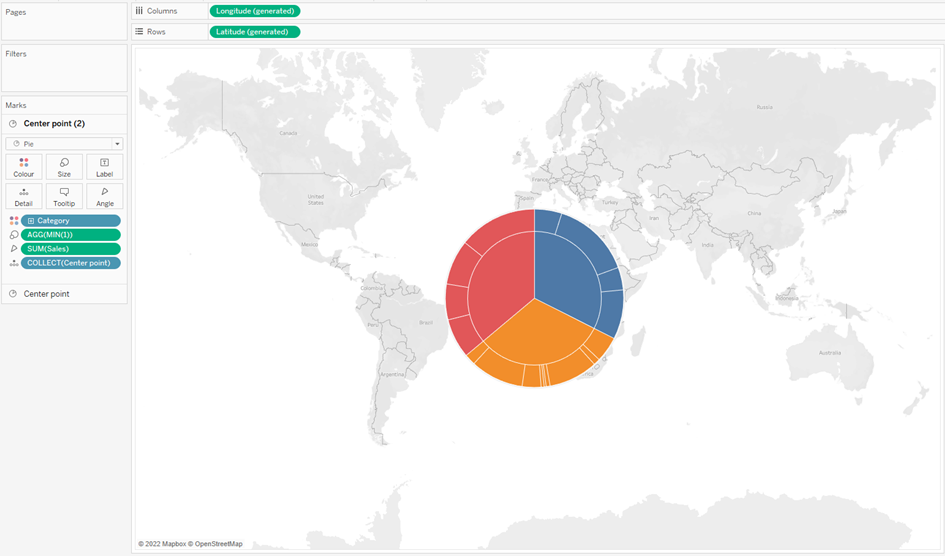
2. Last layer: Sub-Category
Bring the Center Point to the view, Sales to Angle, Sub-Category to Detail and Category to Colour. Don’t forget to change the type to Pie.
Add MIN(1) to Size to adjust the size.
I bring in the border so that it’s easier to follow.
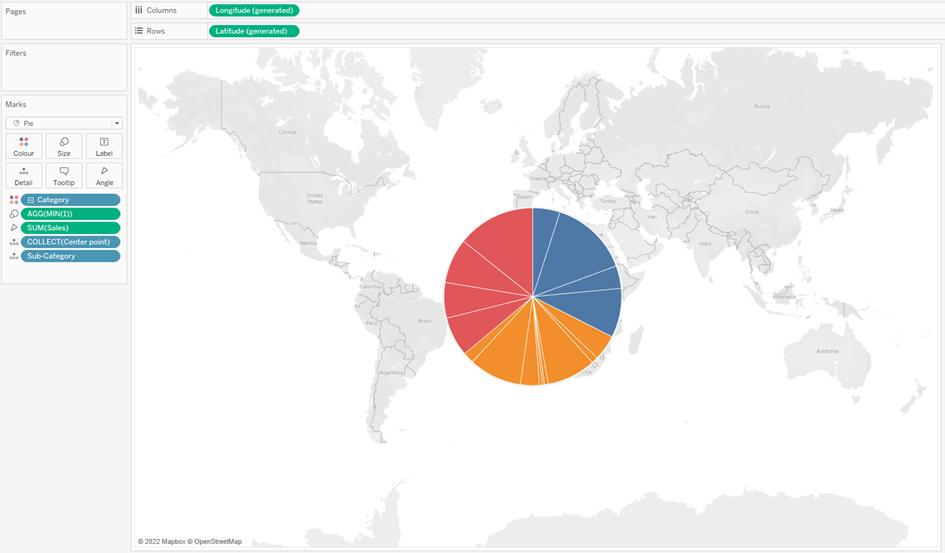
And yet don't worry about the map background at the moment.
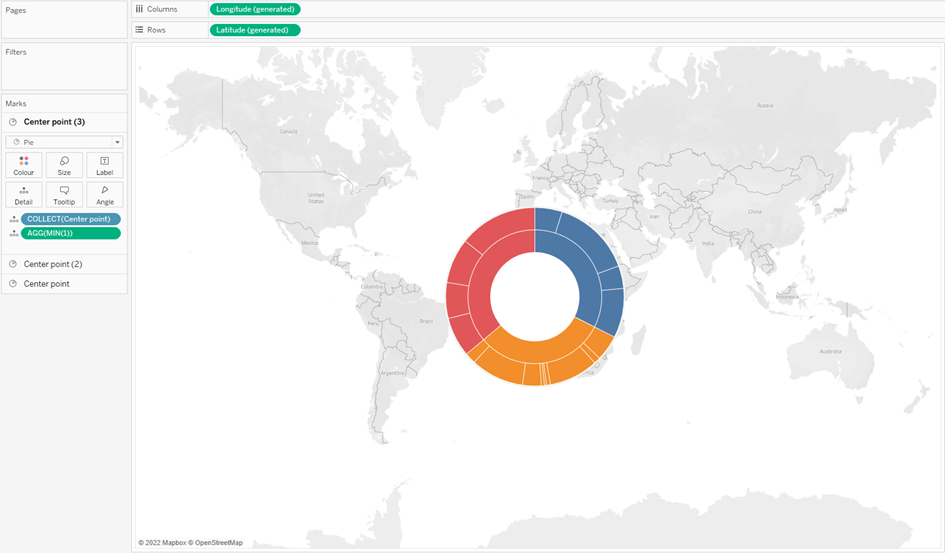
3. Second Layer: Category
Left click on Center point, hold it and bring to the view. Now you notice that Marks Layer appears and you can drop it there.
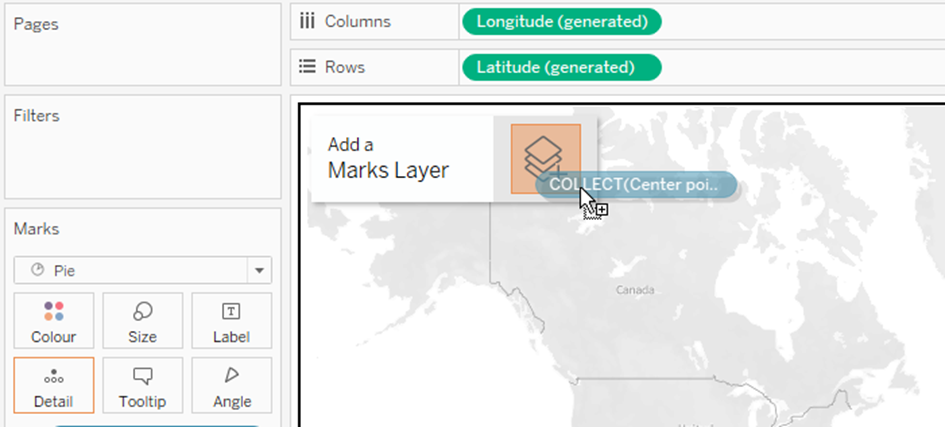
Configure in the marks card similar to above. Now we just need the Category.
Because it is laying infront of the Sub-Category pie, the size should be smaller so you could see a part of the pie behind.
4. First layer: the blank circle
Repeat putting the center point in the Map Layer. Simply color it white
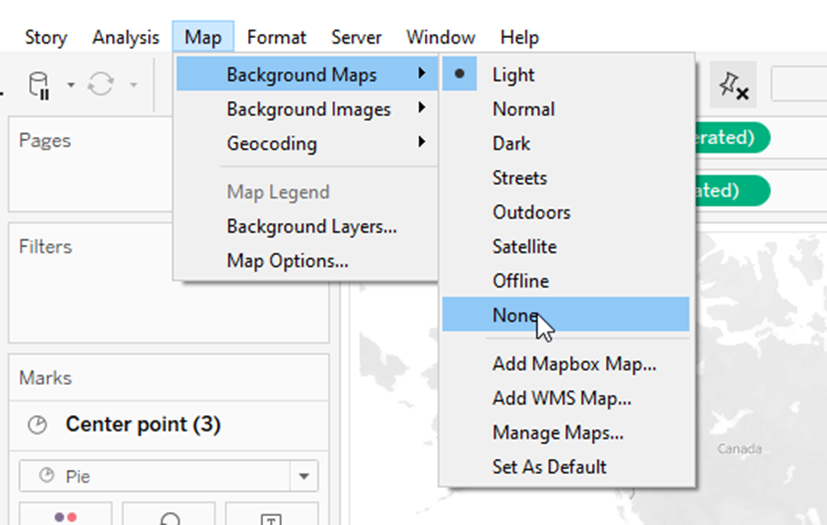
5. Cleaning/Formatting
- Turn off the Map background
- Clearing all the grid lines, zero line etc.
- You can play around with it, like decreasing the opacity of the colours or adding an other layer in between.
You final result could look like this:
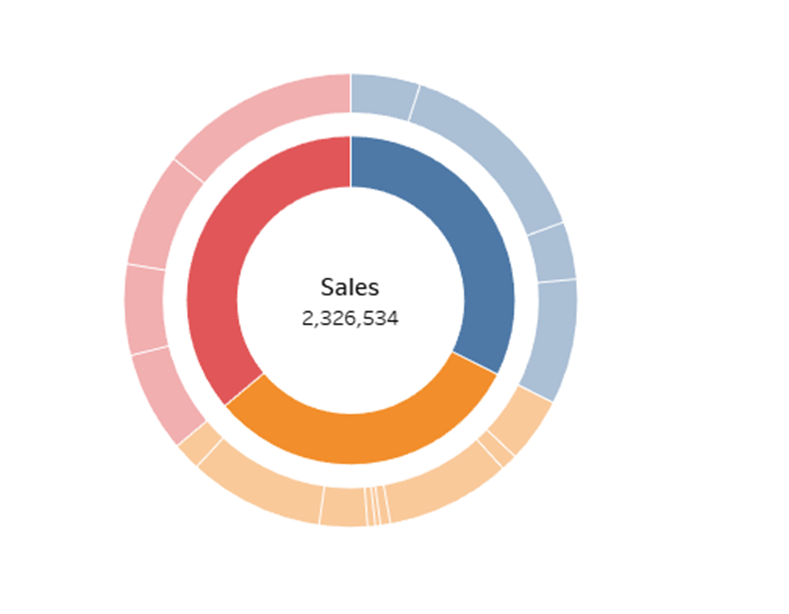
Cheers!