


Bookmarks in Power BI are a feature that let you save and recall the state of a report page. Think of a bookmark as a snapshot of how your report looks and behaves at a specific moment.
A bookmark can store one or more of the following:
Data state
When a bookmark captures the data state, it remembers exactly which data the user was looking at. This includes all filters applied at the report, page, and visual level, as well as any selections made in slicers. The data state also includes drill behavior. If a visual was drilled down to a lower level, such as from Country to City, the bookmark will reopen that visual already drilled to that level.
When the bookmark is applied later, Power BI forces those exact filter values back, even if the user changed them.
Display state
A bookmark can also capture the display state, which controls how the report looks rather than what data it shows. This includes whether visuals are visible or hidden, whether a visual was in spotlight or focus mode, and how visuals were sorted. This is what allows bookmarks to be used for things like showing and hiding panels, creating pop-up explanations, or switching between summary and detailed layouts without changing any filters.
Current page
Finally, a bookmark can capture the current page. If this option is turned on, the bookmark remembers which report page you were on when it was created. When the bookmark is applied, Power BI automatically navigates the user back to that page before applying any other saved settings.
The most important thing to understand is that these three parts (data, display, and current page) are independent. You can turn each one on or off depending on how you want the bookmark to behave. That flexibility is what makes bookmarks powerful, but it’s also why they can be confusing if you don’t intentionally control what they capture.
How to create Bookmarks
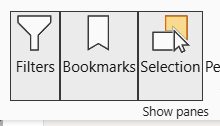
To set up bookmarks, make sure to display the Bookmark and Selection panel. Select them under the view tab at the top.
- On your page, select the charts you want to control and set their visibility in the Selection panel for the view you want your bookmark to have.
- With the selected charts, create a bookmark for your this view and name it accordingly.
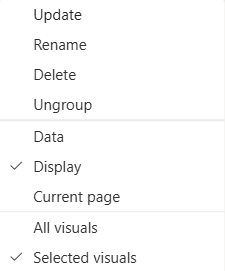
- Right-click and select 'selected visuals' and what view the bookmark should store (data, display, (and/or current page))
This gives you a bookmark. But you can add more than one bookmark. This is where it becomes important that you have clicked selected visuals rather than all visuals. You can follow the same steps as for your first bookmark, but you need to make sure that you have ticked selected visuals, otherwise your bookmarks might overlap and won't show what you want it to.
You can update a bookmark following the
Including a bookmark on the page
You can now add the bookmark as a button.
Click on insert at the top of your screen > buttons > navigator > bookmark navigator
You can add this to swap between a map and a bar chart for example. You can edit the bookmark under format navigator > visual > bookmarks
Now you can use those buttons to navigate between your views.