


Dashboard Week continues, and Andy gave us some great data this morning using the Rick and Morty API. We all had a lot of fun going through the data, although we were lucky that a few of us watch the show which helped a lot with checking that our data was correctly prepped. To actually collect the data, the API was very user friendly. My complete workflow is probably a bit too long to go through in one blog, so I thought I’d quickly walk through the simple macro I made to collect the data.
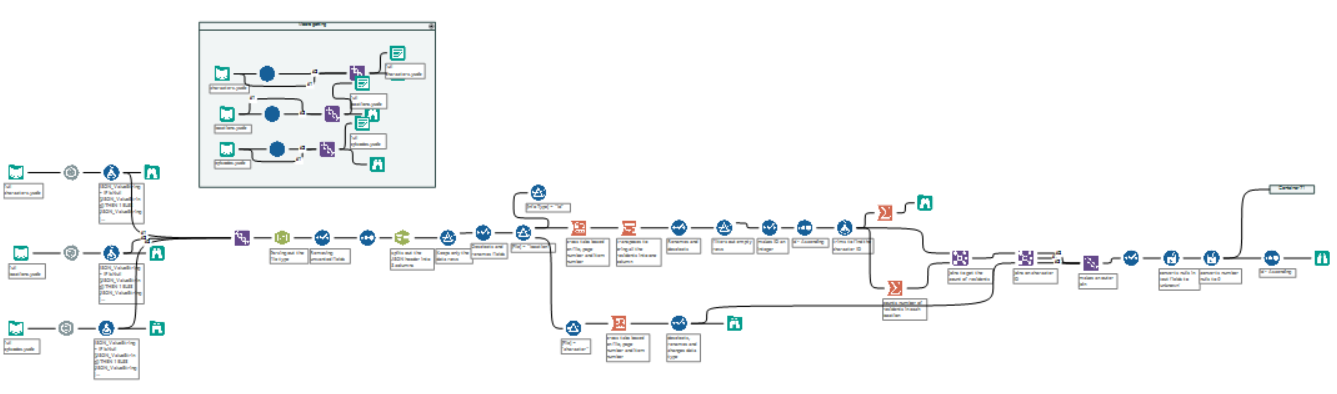
My full workflow
APIs
The Rick and Morty API has three main request types: Character data, Location data and Episode data. If you use the download tool calling for all the Character data and then parse out the data you get something that looks like this: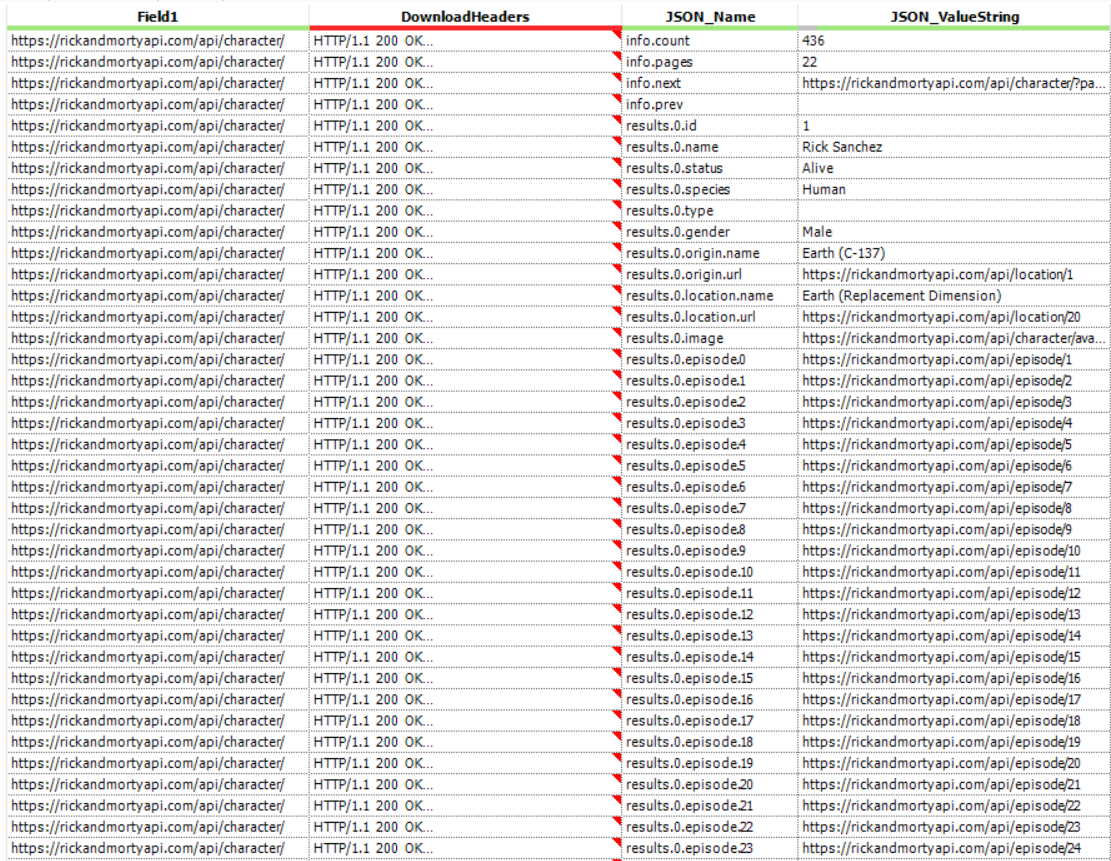
The first two rows tell you the number of characters (436) and the number of pages (22). So the information about the 436 characters is split over 22 pages with around 20 characters per page. Since we want all the information, then we need to call the API for every page. Thankfully to do this we just update the url. So https://rickandmortyapi.com/api/character/ turns into https://rickandmortyapi.com/api/character/?page=2 (which then turns into …page=3 etc.). As we know the total number of pages (22) then we can simply update this url until …page=22. However! There are different numbers of episodes, locations and characters, so we can’t just run the API for 22 pages for each. This is why I made a macro that takes the number of pages and creates a list of urls to download all the data for each type.
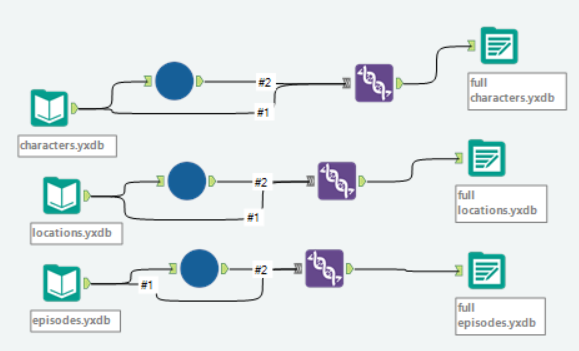
Since there is a daily limit on API requests per IP address (and there were 9 of us all connecting to the API) I downloaded the first page for each data type and saved it as a .yxdb. I also saved the collected data as a .yxdb so I could then use these yxdbs rather than hit the API every time I ran my workflow.
collecting all the data
Inside the Macro
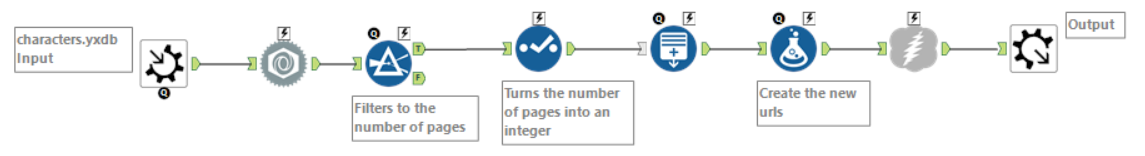
The macro starts by taking the characters.yxdb, converting it to a Macro input (by right clicking it) and then using the JSON Parse tool to parse it out.
Next we filter for the row which has the page number ([JSON_Name] = ‘info.pages’) and then convert the resulting string into an integer. This tells us the maximum number of the final page number. Next we use the Generate Rows tool to then iterate down from that maximum number until it reaches 2. The reason we stop at 2 is that we’ve already got the first page.
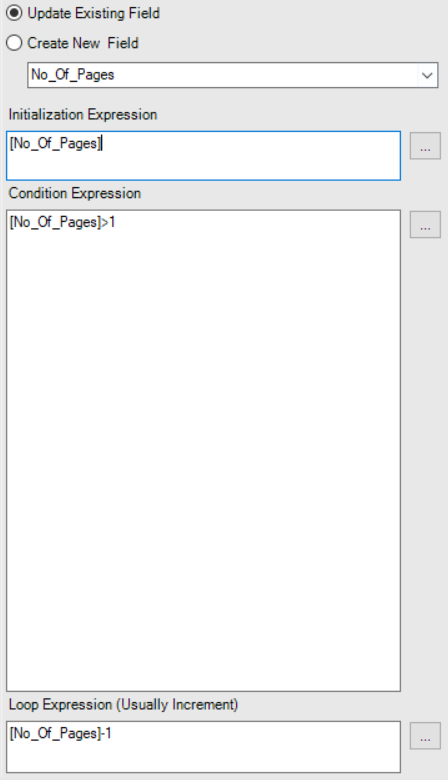
Generate Rows setup
We then use a Formula tool to create the new urls. This takes the original url (Field1), adds ‘?=page’ and the result of the row generation.
[Field1]+’?page=’+ToString([No_Of_Pages])
Finally, we feed our new urls into the download tool to get all the data for the Characters. Since we have a macro input and output, I can then connect this macro to the yxdbs I made of the first result for Character, Location and Episode. I then Union the output with the yxdb to get the first page data too, and output that as a yxdb so I never had to connect to the API again 🙂
If you want to see my viz you can find it here; and if you want to find me on twitter you can find me here.