With this and Tim’s post yesterday, diverging bar charts are apparently very much in vogue at 33 Cannon Street. However I wanted to look at a different type of chart – the diverging stacked bar.
A word of warning though – be careful when you use these. For last weeks presentations, I made a similar bar and got taken to task by the combined forces of data schoolers past and present. I think that the data I’ve used for this blog legitimately calls for the use of this type of chart, but if you’ve got different ideas, then do @ me on twitter.
This blog will be broken into 3 unequal parts: first a section on the data and why I think this is an applicable chart type, then a section breaking down how it will be made in theory, and finally going through the specifics of making the chart in Tableau – using Steve Wexler’s approach (which can be found here).
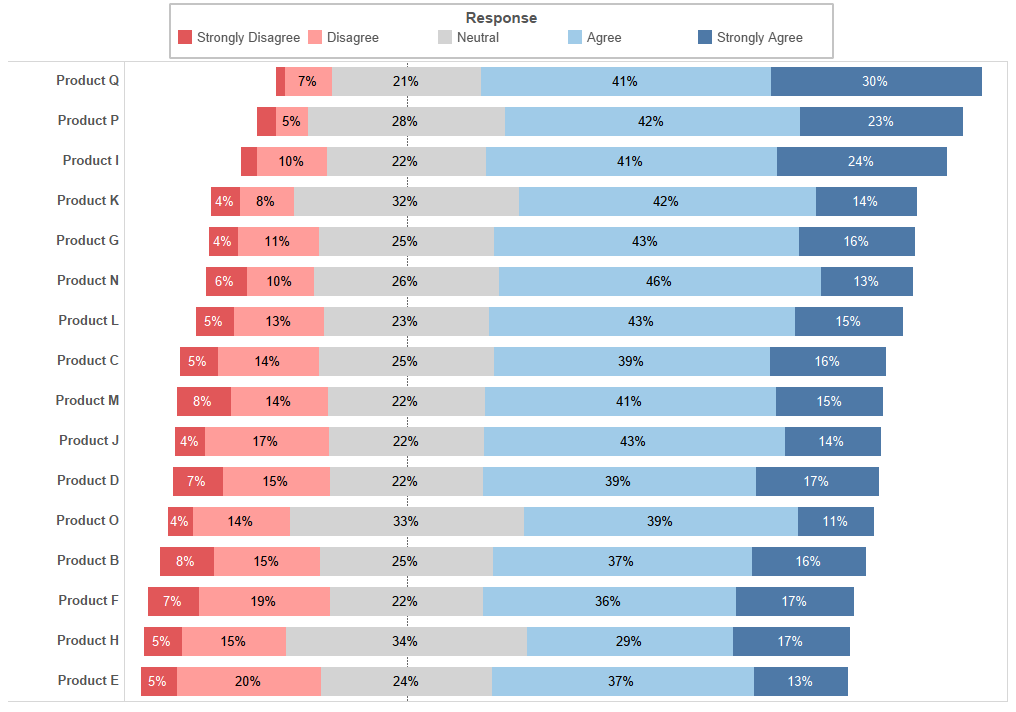
The Finished Chart
The Data
The data I’ve got for this post is the results of a survey asking consumers to rank their response to the statement “I would recommend Product [x] to my friends and family”. They were asked to pick one of ‘Strongly Disagree’, ‘Disagree’, ‘Neutral’, ‘Agree’ or ‘Strongly Agree’. Now, we could easily make a stacked bar chart showing the percent of total coloured by response as I’ve shown below. But there is a dichotomy in our responses which I wanted to reflect in the visualisation – 2 are negative and 2 are positive (the other is literally neutral). As such I wanted to set up my stacked bar diverging through the middle of the neutral response. We can easily and quickly see the proportions of negative and positive responses as well as those who felt ambivalent.
The actual structure of data is as follows: 3 dimensions – [Product], [Response] and [ID] (a unique number assigned to each respondent). We can do a count distinct of [ID] to use as a measure.
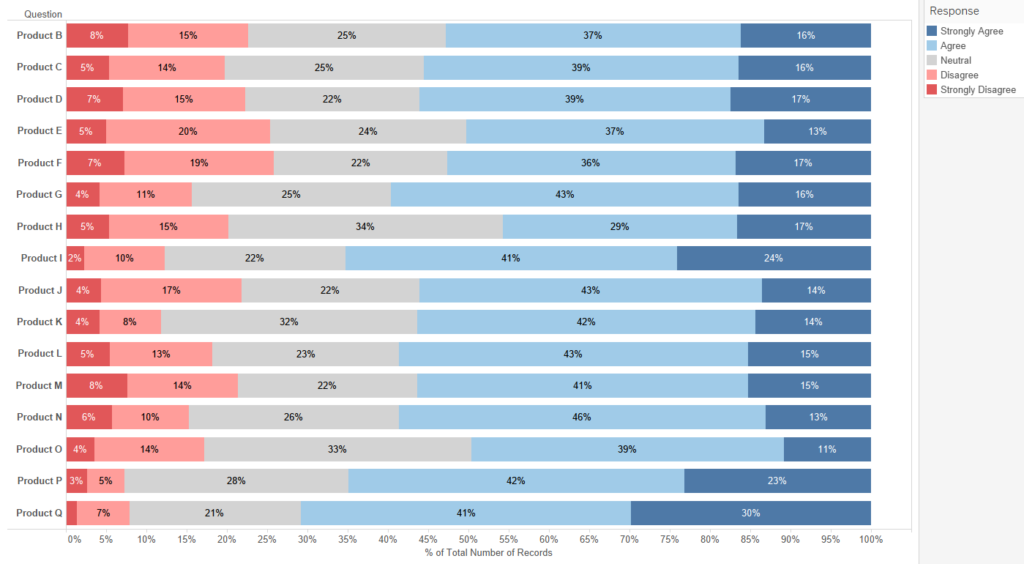
Normal Stacked Bars
The Theory
In order to work out how to do this in tableau, we first need to work out what we actually want to do. Let’s start by breaking down what makes a stacked bar. It’s going to help us a lot if we stop thinking of a stacked bar chart as a single entity, i.e. this:
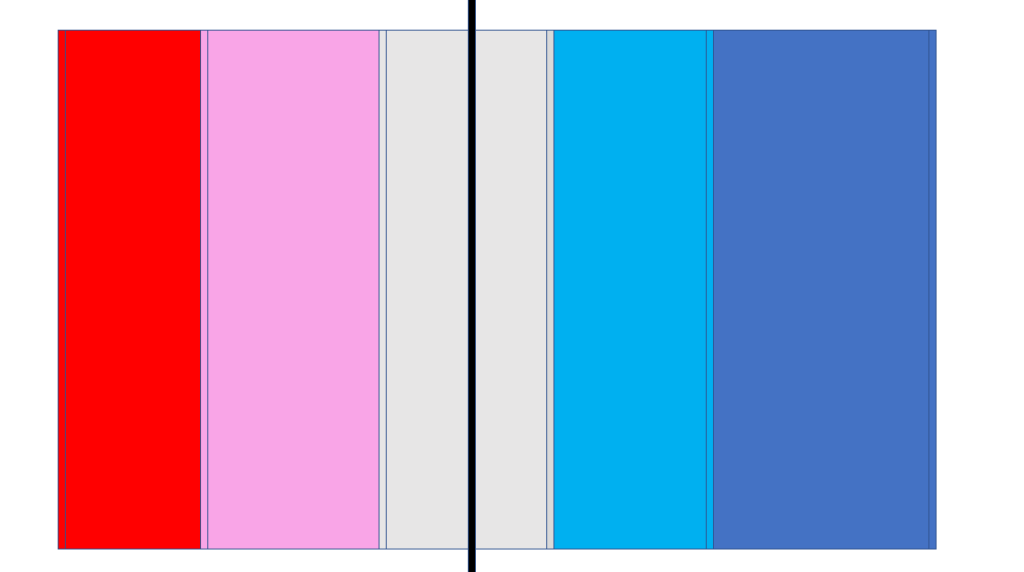
and instead start thinking of it as a succession of fat vertical lines like this:
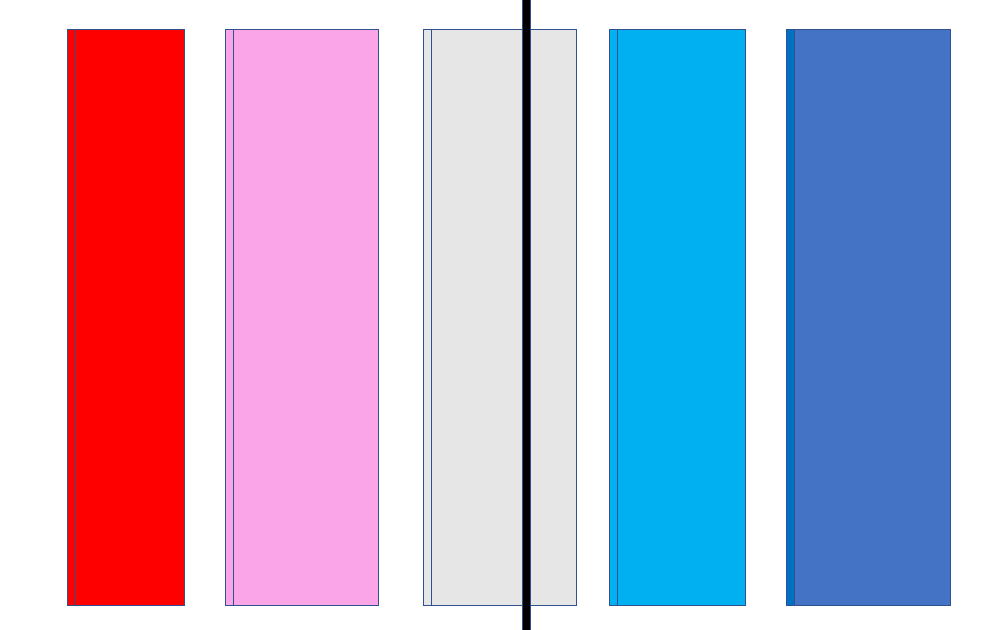
If we do this, then it’s much easier to think about how we will eventually make our chart using gantt bars. So now we know very vaguely how we’re going to make our chart, let’s get down into the details. Once again, let’s change how we think of our chart and go from fat lines to thin ones:
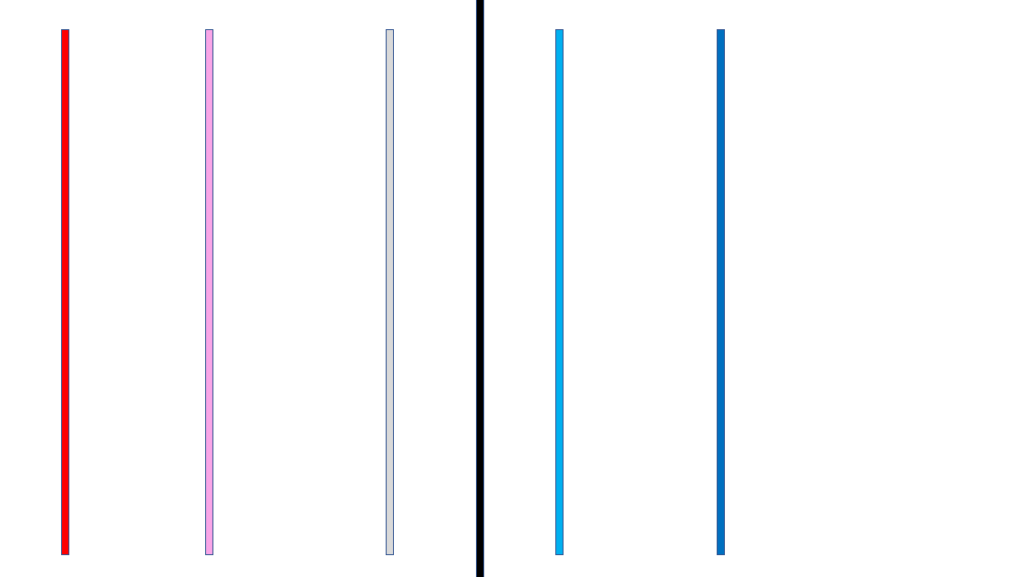
Now we can see that in order to make our final chart, we will need two things – the position of the first line, and the distance between each line (in my diagram A and N). The position of each new line is found by adding N to the position of the previous line. 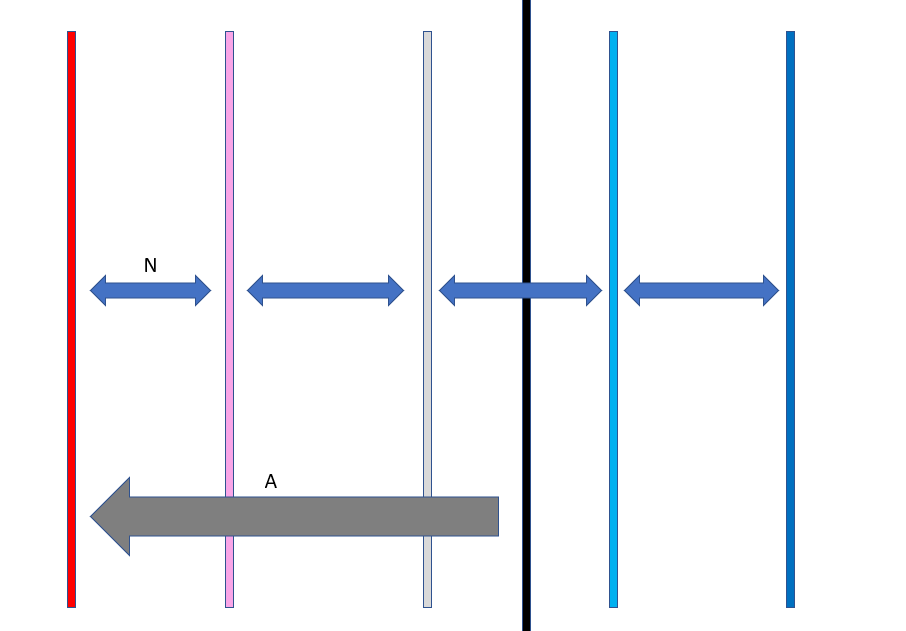
The width of each line is pretty easy to work out as the number of responses that chose each answer divided by the total number of responses. So how do we work out A? If we go back to thinking about our diverging bar as a whole, we want the neutral section to be perfectly bisected by the zero line. This means that exactly half of its area should fall on either side of the zero. So we can find the position of the first bar by adding the widths of both ‘Strongly Disagree’ and ‘Disagree’ to half the width of ‘Neutral’. (Or in the language of my diagram: A=X+Y+0.5Z ). 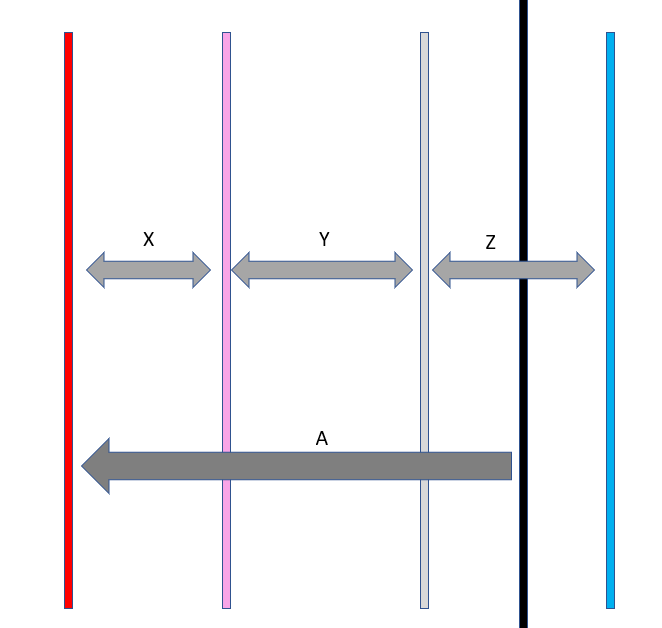
So to build our chart we will need the position of the first line (X+Y+0.5Z) and each response’s percent of total. Now we know how to make our chart in theory, let’s fire up Tableau and make it in practice.
The Build
As I said earlier, the method for building this graph in Tableau comes from this Steve Wexler blog.
Before we start, as an N.B. this chart requires a number of table calculations; these are all computed using [Response].
The first thing we want to do is work out the position of the first line. To do this we create a calculated field which counts the number of negative responses as well as half the neutral responses.
 So working from the inside out: the conditional statement assigns 1 to both negative responses and 0.5 to neutral; these values are then summed for each product. If we put this calculated field in a table along with the COUNTD([ID]) we can see what it’s doing:

Next, because we’re making a ‘% of Total’ stacked bar, we need our total.


So to work out where our first gantt bar should be, we make our Total Negative value negative and then divide it by our Total Count value.


Now we have the starting position for each of our stacked bars. We can quickly bring [Start] on columns and put [Product] on rows to see:
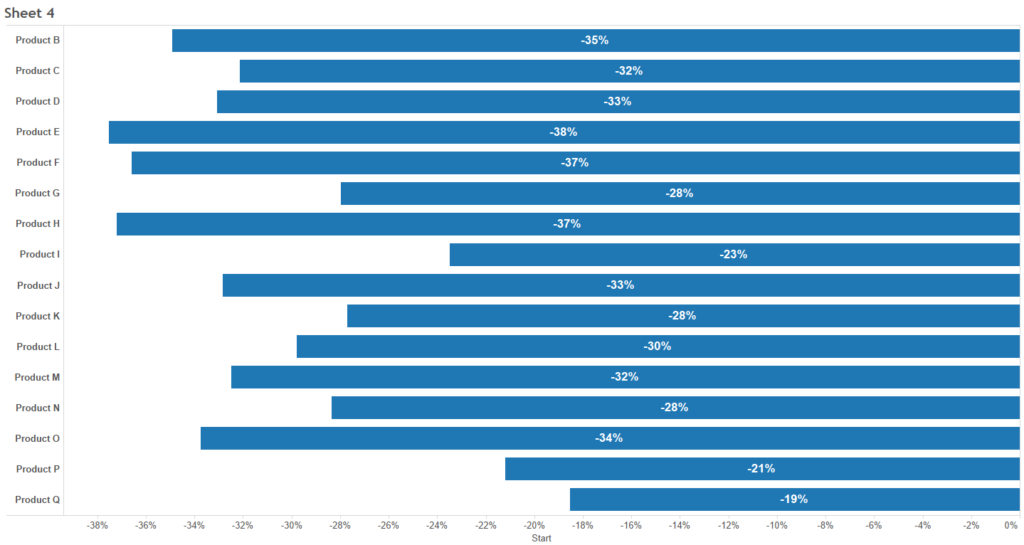
Having found our start point, we need to find the width of our gantt bars. As I said earlier, this is a percent of total calculation:


So now we need to combine our start position with our percent of total. This is the slightly tricky part. To find a response’s gantt position we take the previous responses position and add the current’s percent of total value. For the first position, we have to instruct Tableau to take the start value.

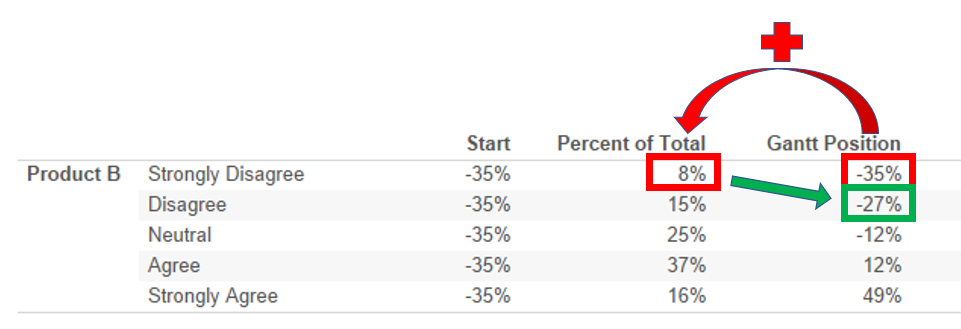
So our calculated field takes the previous value (or [Start] if there is no previous value), then adds the percent of total from the previous row (or 0 if there is no previous row). If we put this in the view, then we can see how close we are to having our finished chart.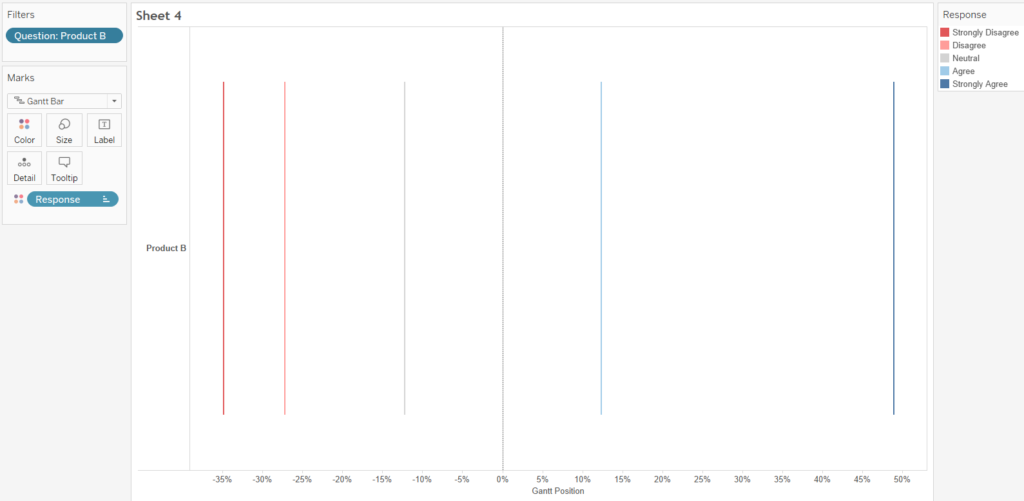
In fact, the only thing we need to do is drop [Percent of Total] onto the size card:
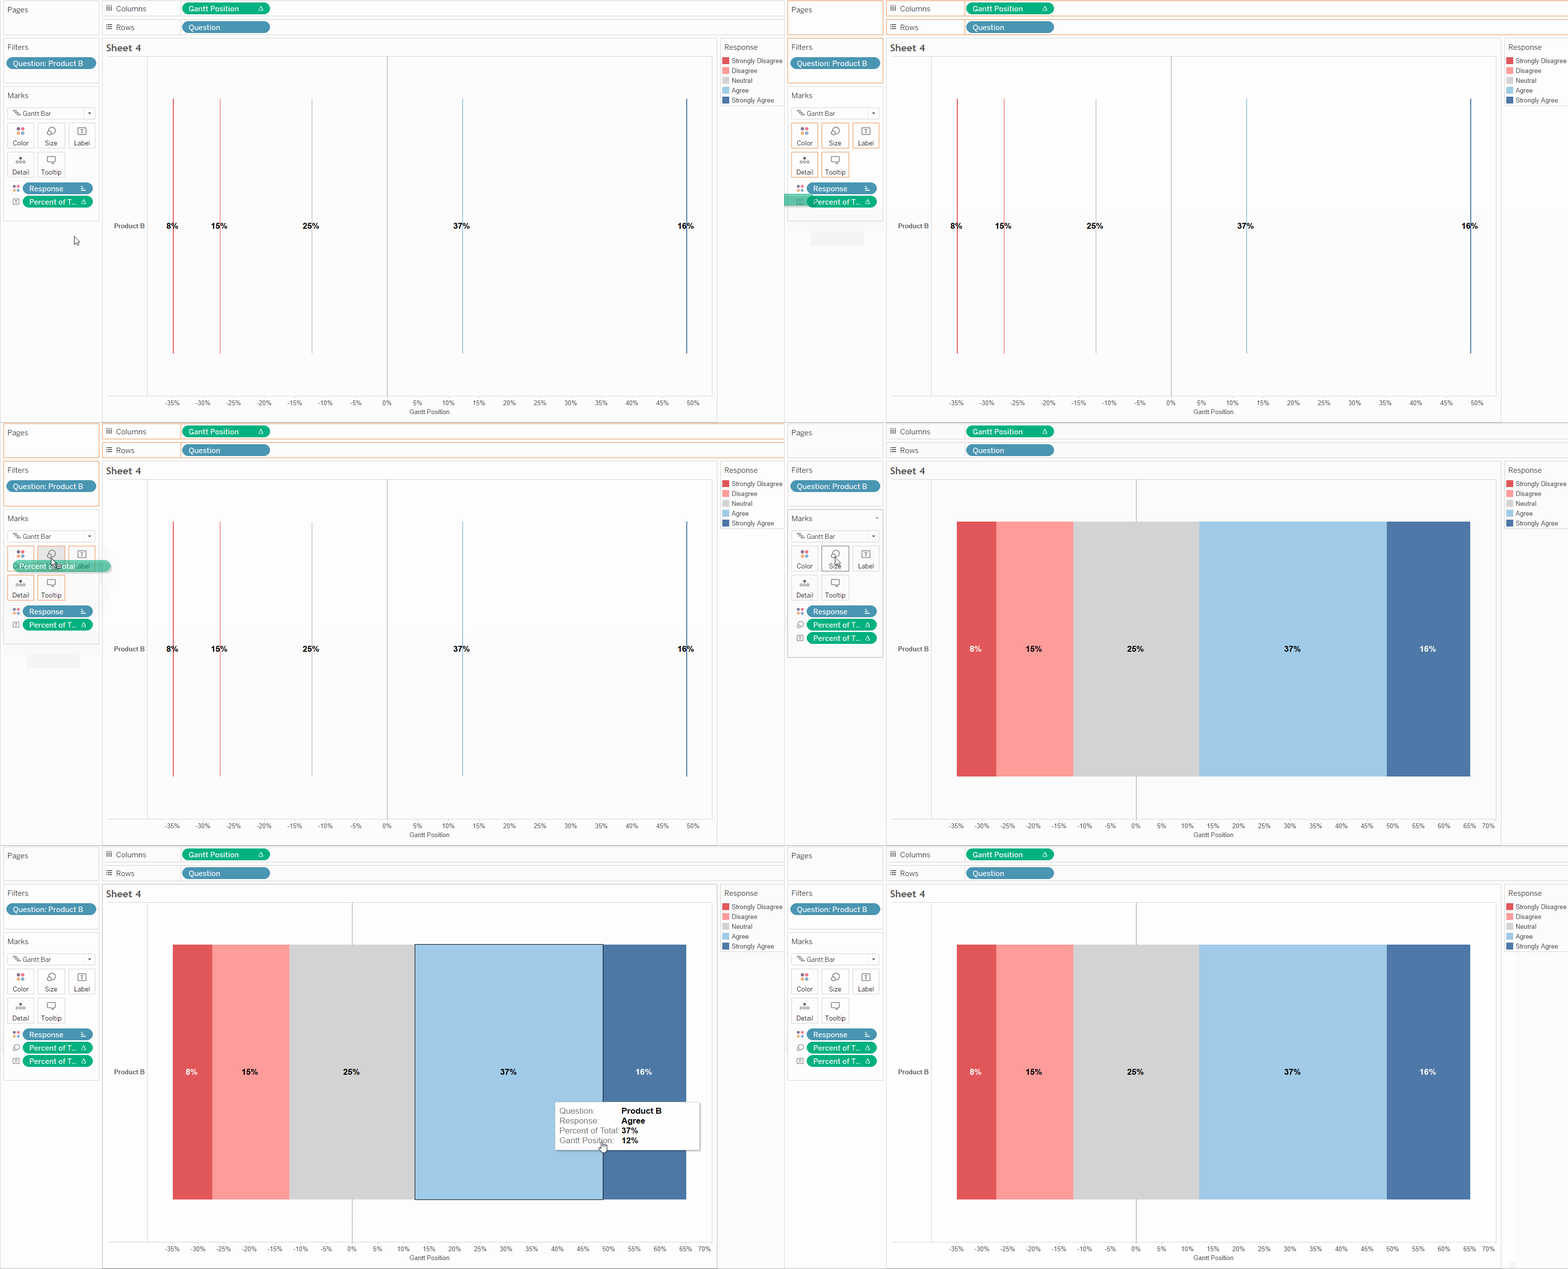
So there you have it, a diverging stacked bar chart. Put [Percent of Total] on labels, and sort by [Start] and you’ve got the chart I showed all the way back at the beginning of this post.
Hopefully you found this post interesting, useful and easy to understand, but if you have any questions then you can find me on twitter at @olliehclarke.
