This week was Teaching Week in DS8, and Jevon took it upon himself to educate us in the ways of Data Densification. He had a cool exercise looking at ways of counting how many lightbulbs were on at one moment, but I’ll leave him to explain that. As part of his exercise he wrote a calculated field which ‘filled in’ rows a lot like the Multi Row Formula tool can do in Alteryx. We immediately got to put this calculation into practice helping someone out on our CoE. They wanted to be able to count how many tickets were open any given month. In this blog I’ll walk through how I went about solving this problem.
Data
I’ve created some dummy data that is in a similar format so we can go through it here. For each ID (ticket number) there is a Start Date. However, an ID will only have an End Date if the ticket has been closed, so for some IDs, the End Date column is NULL.

Our first step when dealing with data in this format is to pivot the two date fields, so we end up with one date field, and another column saying whether it is a Start Date or an End Date.
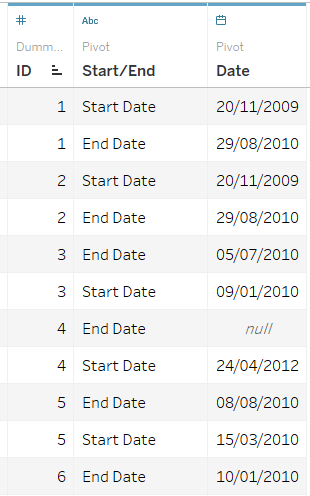
With our data pivoted, we can now look to start counting tickets.
3 Calculations
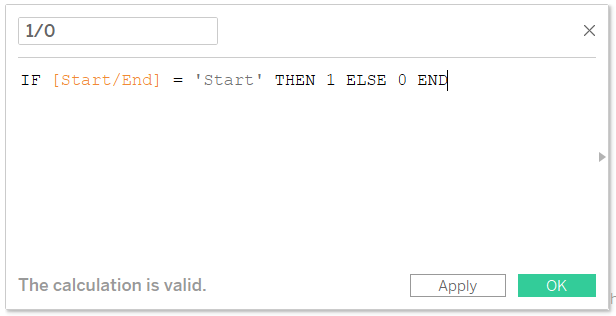
To tackle this problem we will first need to turn our dates into numbers which can be counted. This is easy enough to do. As we want to know how many tickets are open at any time, then we write a simple calculated field which turns ‘Start Date’ into 1 and ‘End Date’ into 0.
If we now make a table of IDs and Dates, with this on text, we can see when a ticket opens and closes.
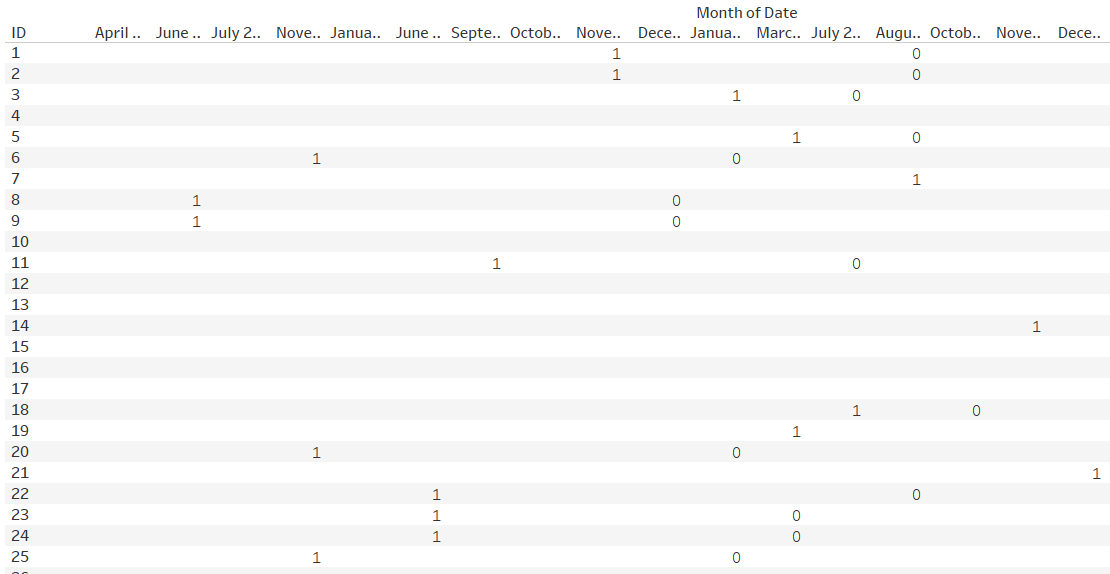
The next step is to use Jevon’s magic calculated field to fill in the rest of the table. Basically what we want to do is convert any nulls to 0s, leave the Start Dates as 1s and make any date between the Start Date and End Date a 1 too. Our calculation keeps End Dates as 0s, so we’re working under the assumption that if a ticket closed on a date, then it wasn’t open at any point on that date. The calculation we use is this:
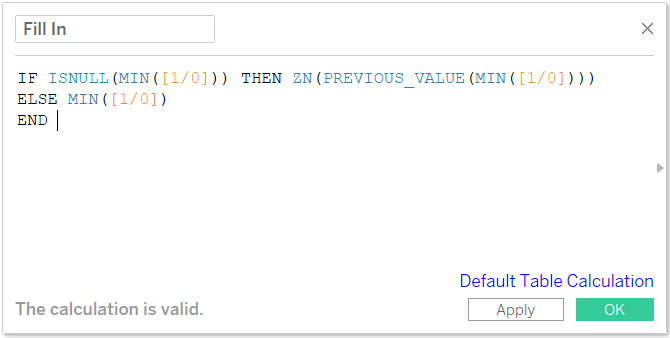
If we parse this calculation out into normal English, it checks to see if the current value is null. If it is then, converting all nulls to zeros, take the previous value and return that. If the current value is not null, then return that value. As this is a table calculation, we need to make sure it is computed with the right dimensions. In this case, we want it to look at the value to the left of the current, so we leave ID unchecked, and tick Month of Date.
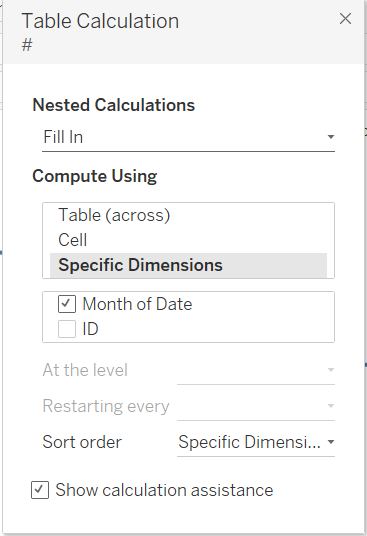
If we put this calculation onto text and move ID onto detail, then we can see more easily what this calculation is doing.
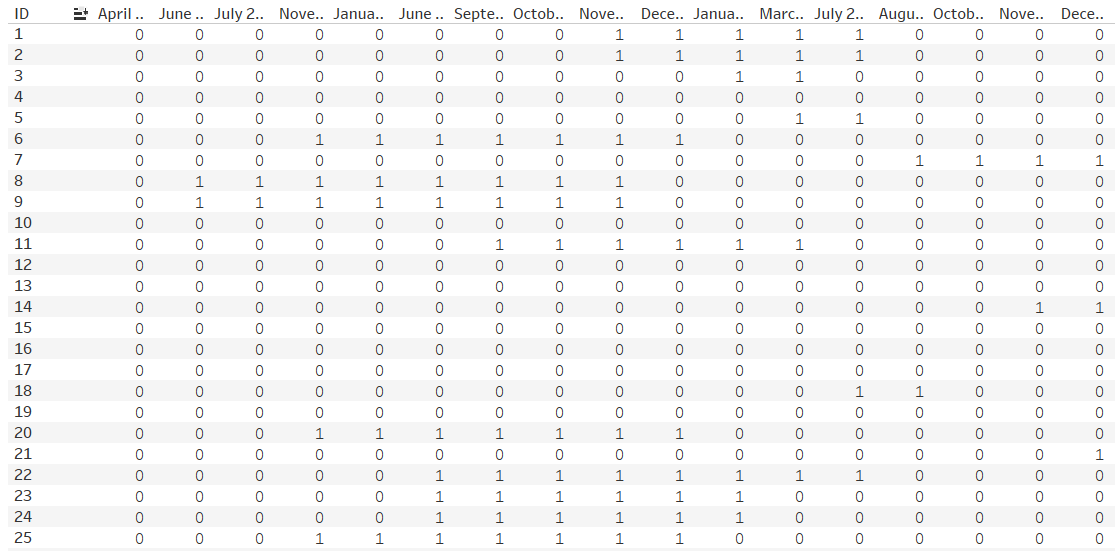
The final step of our task is to look down each month and count how many IDs are returning 1 rather than 0. This will tell us how many open tickets we have each month. Another very simple table calc will suit us here:
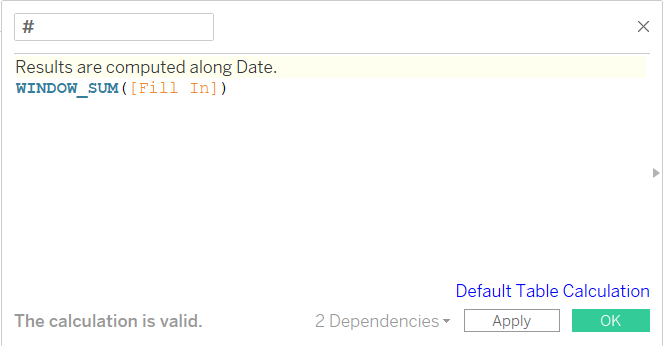
Again we have to be careful how we set up the calc. We want it to restart each month of date, so we leave that unchecked.
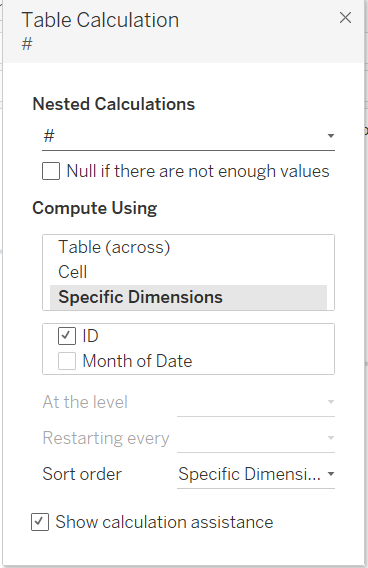
If we add this to our table along with our ‘Fill In’ table calc, then we can it returning one number per date – the number of open tickets.

Last ‘Steps’
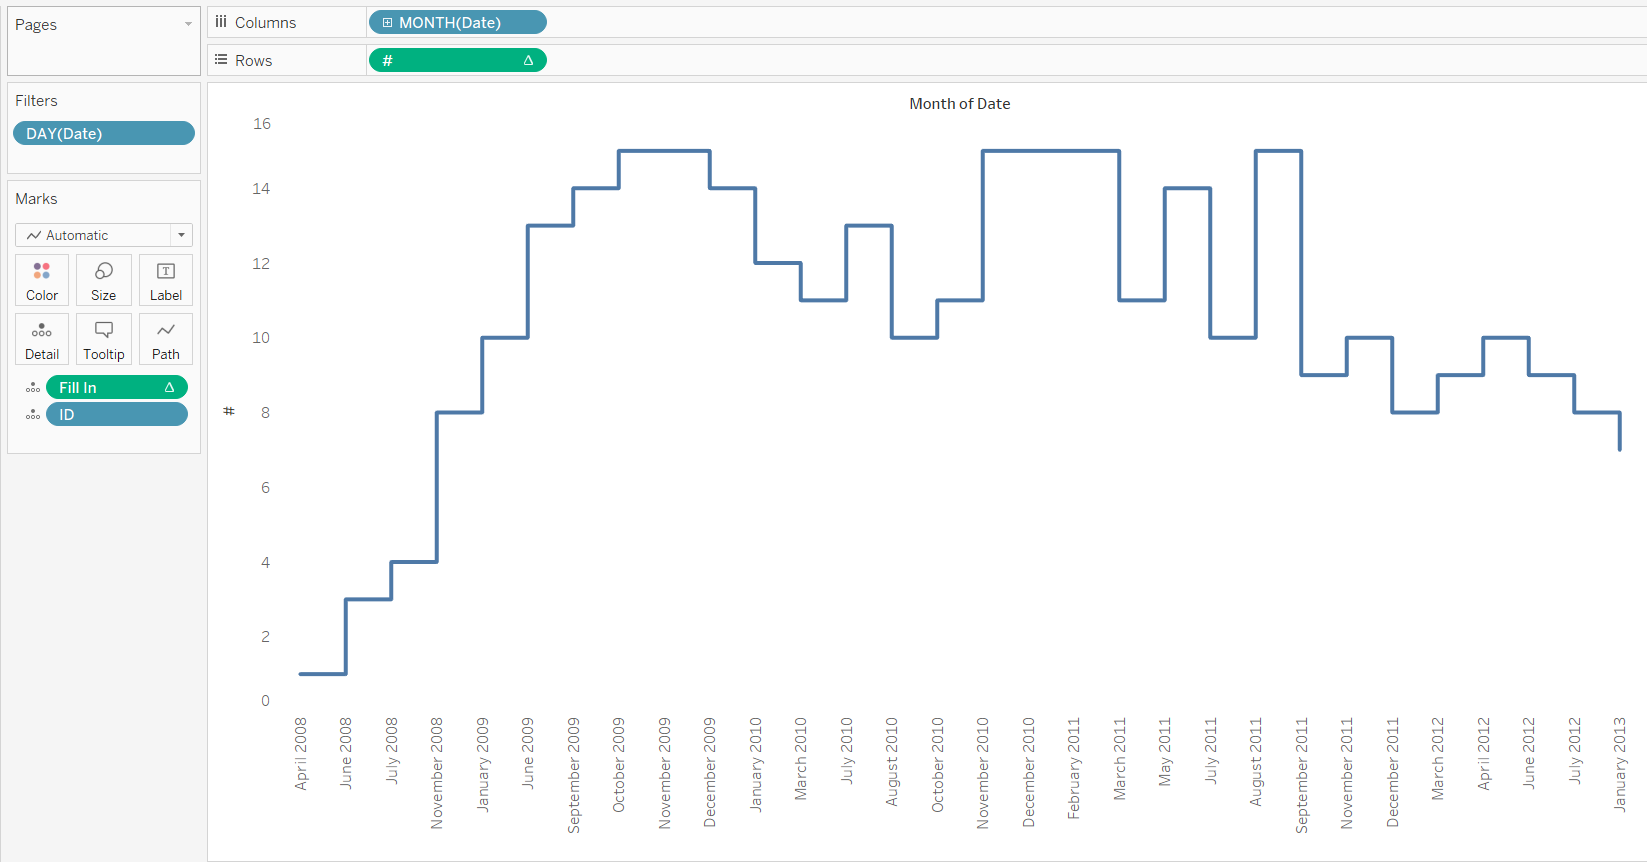
Our final step is to visualise our results. I’ve opted to take advantage of 2018.1’s stepped line feature to show how many open tickets we have each month.
I hope you found this blog interesting, and useful. As always, you can find me on twitter @olliehclarke.

