


Introduction
In my second post, I’m going to take a closer look at one of my own dashboards and consider what improvements can be made. The following three visualizations are part of my dashboard on the topic of productivity in connection with work-life balance. For the redesign of my diagrams in sketch style, I once again used Excalidraw.
Spoiler alert: Since this is a synthetic dataset, the insights should be viewed with a healthy dose of skepticism. ;-)
You can find my dashboard at this link on Tableau Public: https://public.tableau.com/views/TheDataSchool_Work_Life_Balance_final/Work-Life-Balance-Dashboard?:language=de-DE&:sid=&:redirect=auth&:display_count=n&:origin=viz_share_link
1. Stress Levels by Profession
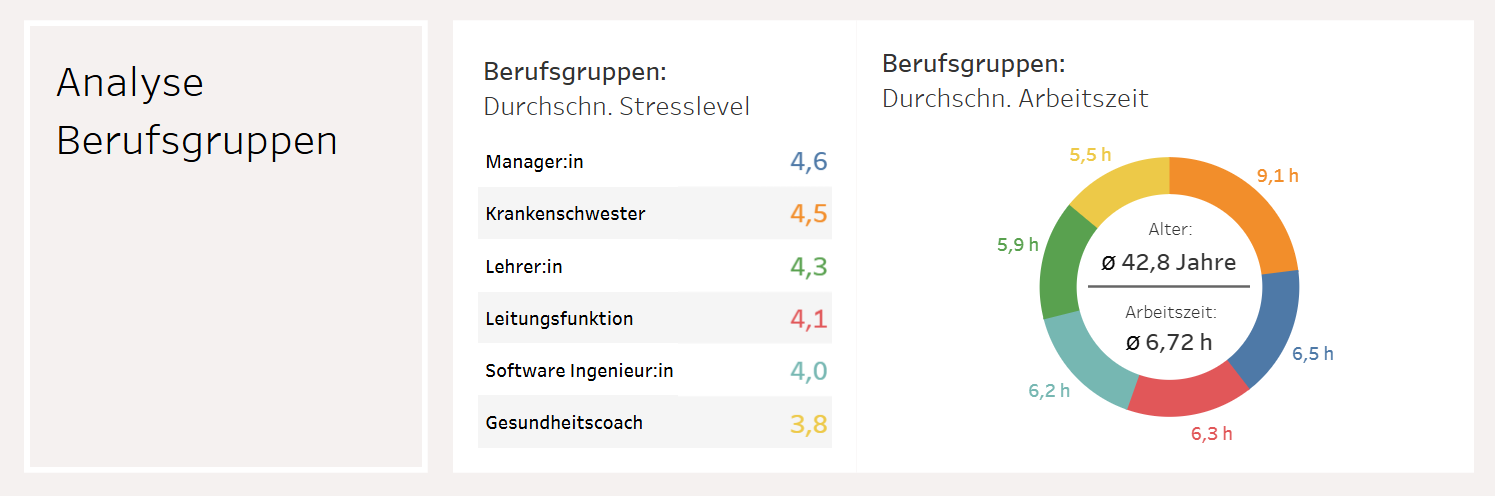
To provide a good overview, I had originally assigned a color to each professional group. The stress levels were sorted in descending order. To show a potential correlation between stress levels and working hours, I placed a donut chart with average working hours on the right side. For comparison, I displayed the average age and average working hours of the entire dataset inside the donut. In principle, different proportions are difficult to compare in a donut chart, which is why I had specified the values in hours (h) in my original version.
1. b) After the revision in Excalidraw
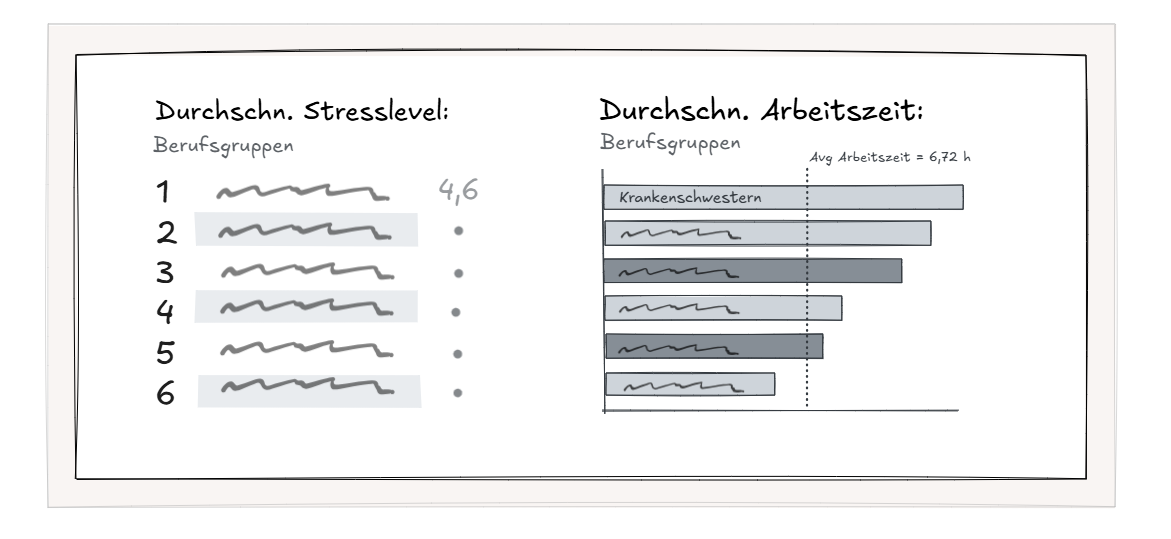
In the new version, I added numbers from 1 to 6 to the ranking to make it clear that this is a sorted sequence. I replaced the donut chart with a horizontal bar chart. Based on the bar length, working hours can be compared much more effectively. I placed the labels for the professional groups directly on the bars. The average working time is represented in the form of a vertical, dashed reference line.
2. Working Hours Trends
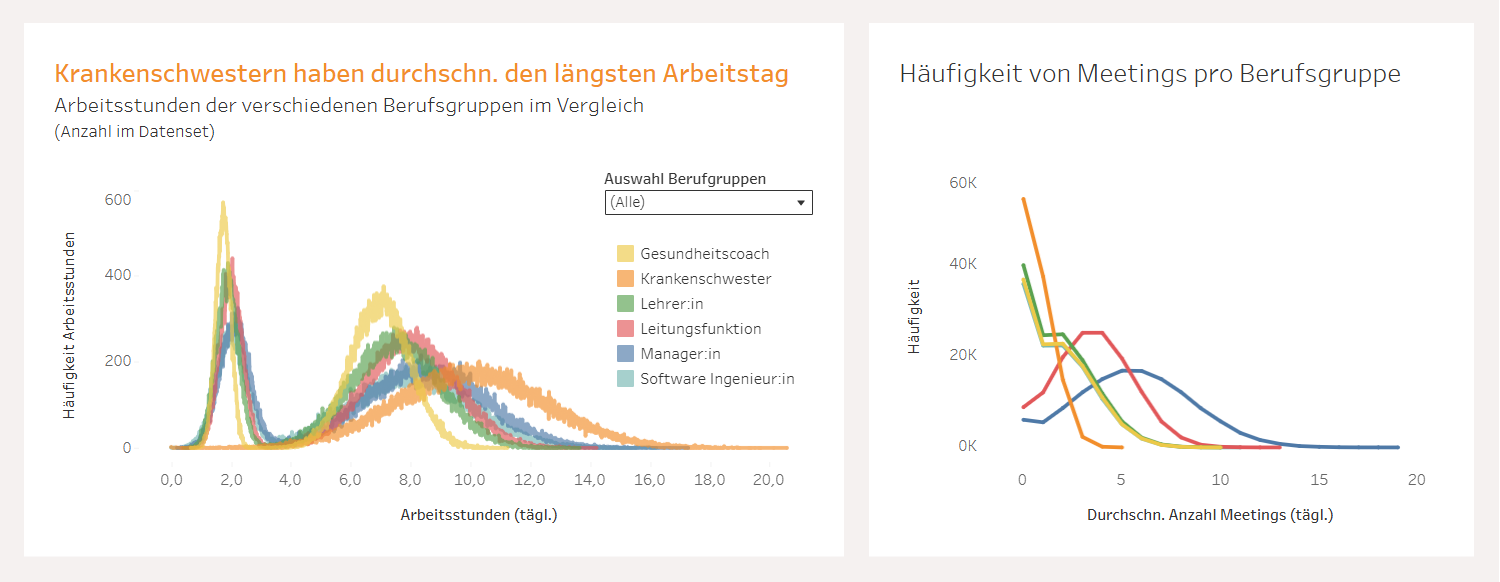
Regarding the second diagram, I also find the number of colors confusing. As soon as all professional groups are selected via the filter in the left diagram, the view becomes cluttered. Assigning the lines to the professional groups in the diagram on the right is also not particularly easy.
2. b) After the revision in Excalidraw
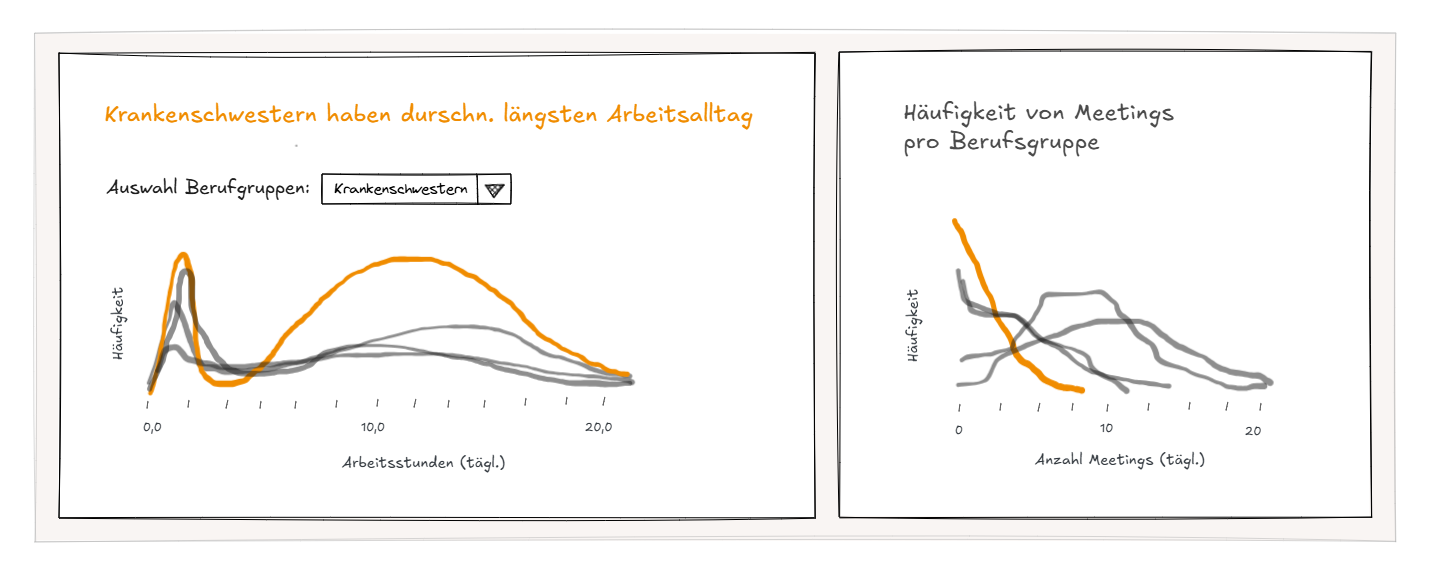
In my new version, I implemented the idea that only one professional group can be selected and highlighted in color at a time. The other lines remain gray. This makes it much easier to track the individual curves.
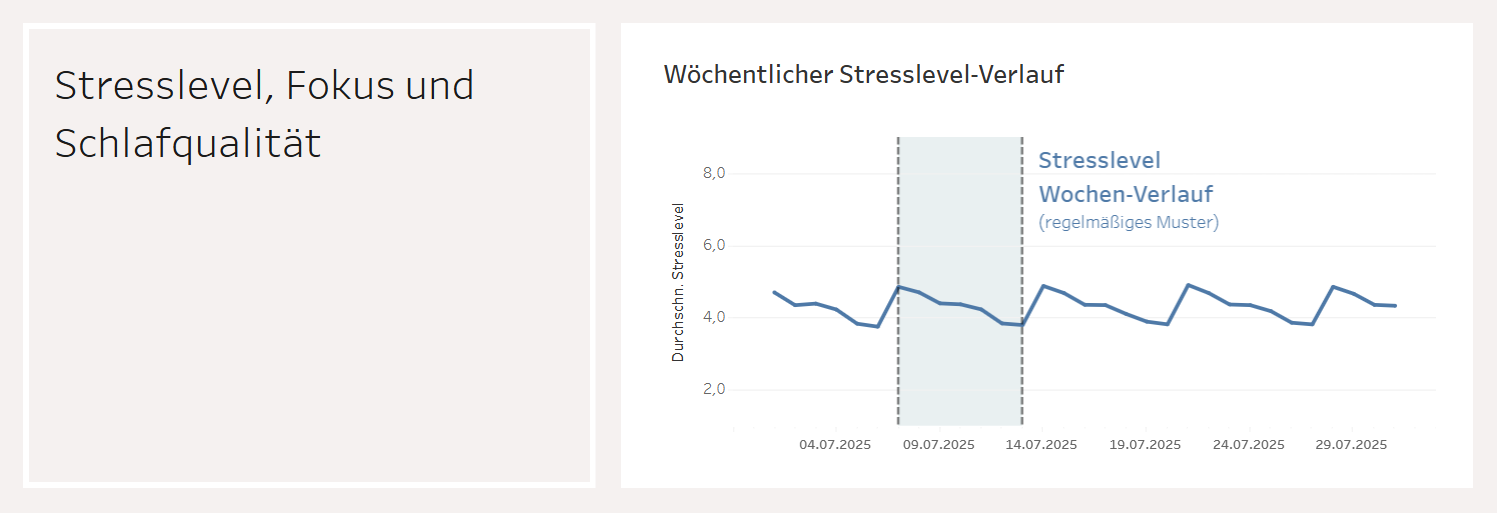
3. Weekly Stress Progression
In my final diagram, I mapped the weekly stress progression. Again, a quick note that these are average values and individual stress patterns can vary greatly. The data used comes from a synthetic dataset from Kaggle and offers little insight into reality. In this case, I was able to identify a regular weekly pattern in the existing dataset, which I highlighted in color and labeled for one exemplary week.
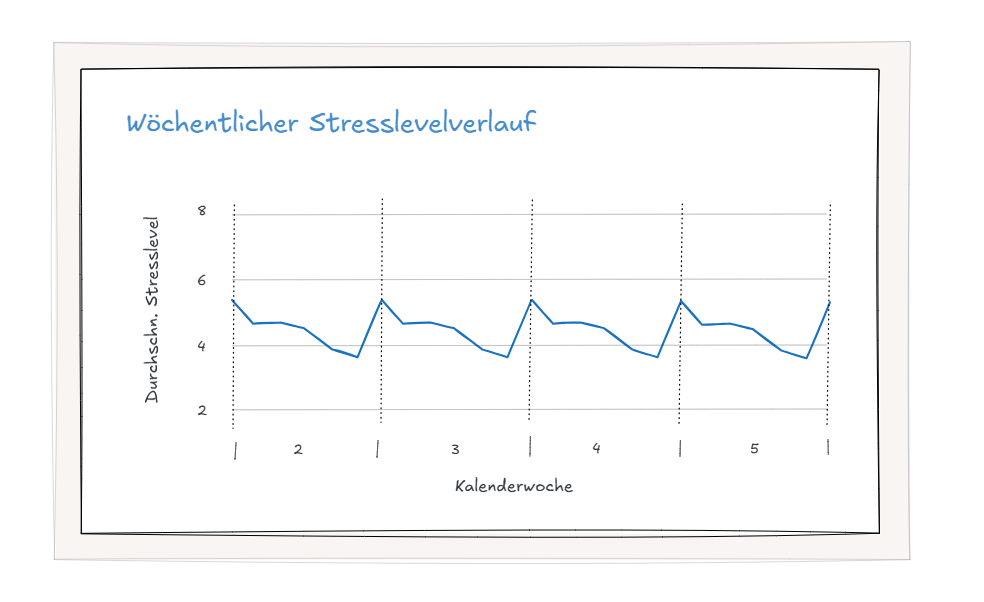
3. b) After the revision in Excalidraw
In my revised version, I added more vertical grid lines to emphasize the regular pattern. I divided the x-axis into calendar weeks to clarify that the stress level starts with the highest value on Monday and then decreases until Sunday. Somehow, the representation reminds me of an electrocardiogram—maybe one could speak of the “stress pulse” of life. ;-)
Closing
For me, this first "Friday Project" was a great retrospective. It shows me that after just one week, I already have a better understanding of good visualization and am on a steep learning curve. I received constructive feedback from my colleagues in the current cohort and our coach, Peter. I am looking forward to the journey ahead and the many training sessions in the coming weeks.