


DS53 have sadly reached the final week of training, and alas that means we are at the famous Dashboard Week!
For Day 1, we were challenged with creating a visual CV/resume in Power BI. Here was the full brief:
- Create your own CV dataset
- Build a visual CV in Power BI
- Publish to Power BI Service
- Make sure to follow the rules as above
- Submit your entry in the contest gallery
- Presentations at 3:30pm
Gathering Inspiration
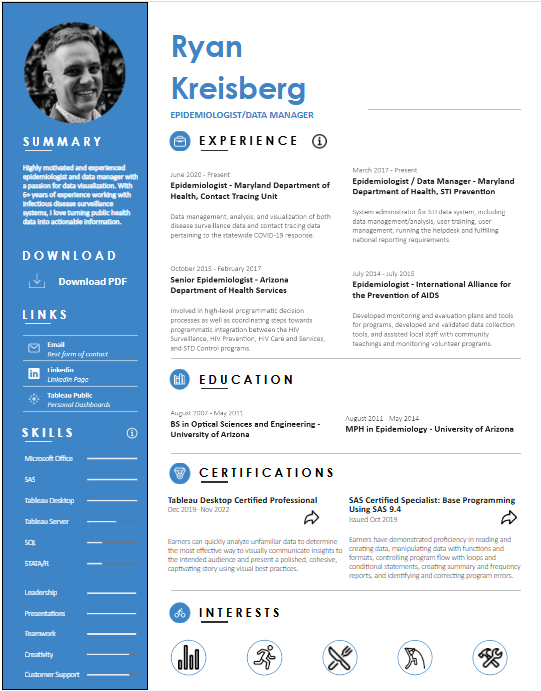
I began the process by searching for inspiration. I really liked this classic CV by Ryan Kreisberg posted on Tableau Public. It has traditional CV elements but elevated with some data visualisation and interactivity.
Planning and Design
I then set about sketching in Excalidraw, mapping out all of the elements I was aiming to include in the final dashboard. I kept in mind Power BI's capabilities and design techniques as I experimented with different colour schemes and searched for Power BI-supported fonts that matched the professional theme I wanted to achieve.
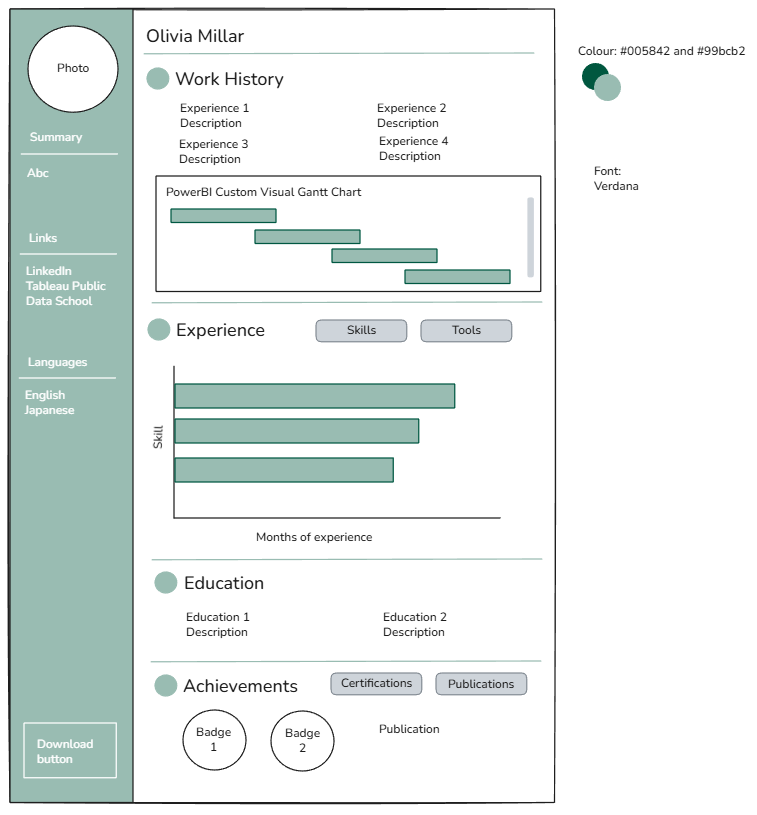
This sketching process gave me a clear idea of how to move forward, and as I was designing the charts I began to understand what shape the data needed to be in.
Data Preparation
I started with a wide dataset for inputting all of my education and employment details. However, I quickly realised that for the bar charts (which would aggregate the same skill across different experiences and total up the number of months) I would need a tall dataset instead.

In Power Query, I unpivoted these fields to create a single 'skill' column and calculated the number of months from the start and end dates. This structure would allow me to plot skills against months of experience, automatically summing across different work experiences. I applied the same approach for the 'Tools' used throughout my career.

Building and Finalising
After a bit more data cleaning, I was ready to build out the CV in Power BI. Following our presentation and some valuable feedback from the cohort, here is the final project, which was also uploaded to the Fabric Data Days Dataviz Contest!