


When you're working in Power BI, understanding the order of operations (OOO) is important for building effective reports. Knowing this sequence can help you decide whether to use a calculated column or a measure.
The Power BI Workflow
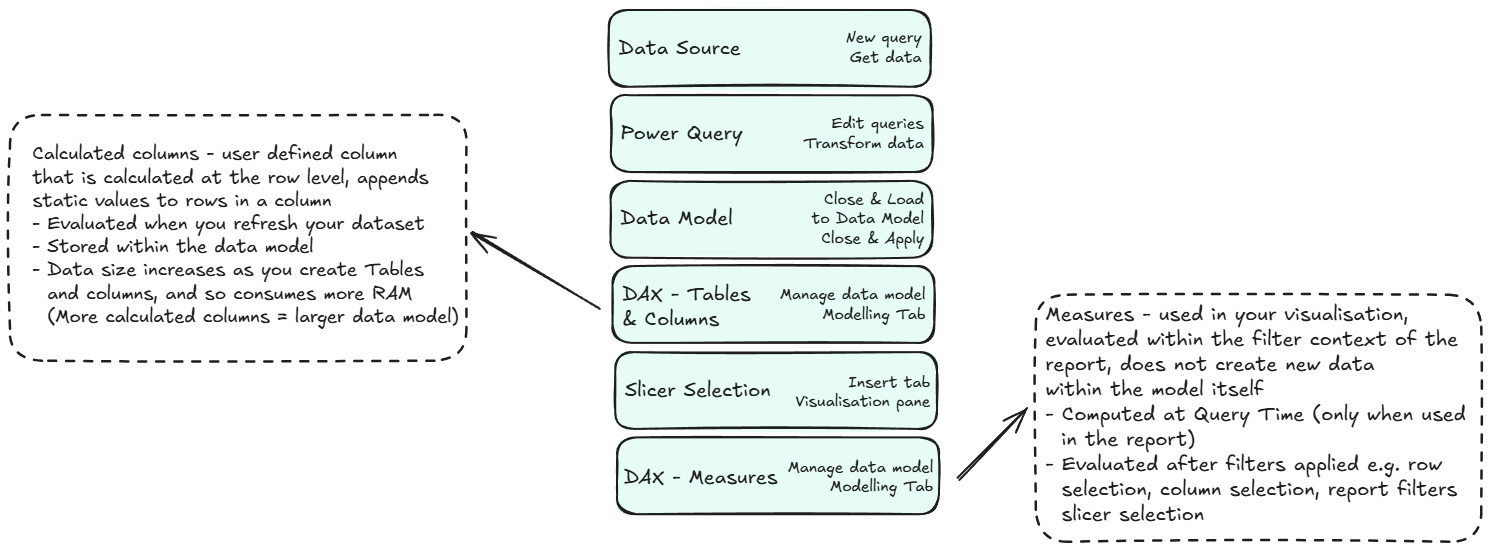
The process in Power BI follows a specific, layered order (also summarised in my image below):
- Raw Data Source: Power BI first connects to and retrieves data from your source.
- Power Query: It then applies any transformations you've defined in Power Query. This is where you clean and shape your data before it enters the data model. You may also add columns
- Data Model: After data is loaded from Power Query, it resides in the data model. Here, you can define relationships between tables, which allow for cross-table filtering and calculations. This structure is the foundation DAX uses for all subsequent calculations you decide to use.
- DAX Tables & Columns: Next, Power BI calculates any DAX-based calculated columns or tables. These are computed at the row level for conditional columns, or as whole new tables for DAX tables, and stored within the data model itself. Because they are static, they do not actually change at the data level when a user interacts with the reports filters or slicers.
- Slicers & Filters: After the any columns or tables are calculated, any report filters or slicer selections are applied. This filters the data that is visible to the user.
- DAX Measures: Finally, any measures are calculated. Unlike calculated columns/tables, measures are dynamic. They are computed at query time, and their values change based on the filter context, meaning they react to the user's slicer and filter selections.
Calculated Columns vs. Measures
The biggest takeaway from understanding the OOO is knowing when to use a calculated column versus a measure.
DAX Tables & Columns
Calculated columns and tables are both created with DAX and are computed at the same stage of the workflow.
- Calculated Columns: These add a static value to each row of an existing table. They are best for creating new dimensional attributes, e.g. a "Product Category", which can be used for filtering or slicing. Since they are stored in the data model, they increase file size.
- Calculated Tables: These create an entirely new, static table which can be based on data already in your model. They are useful for creating things like a disconnected date table or a summary table of key data points. Like calculated columns, they are stored in the data model and do not change based on report filters.
DAX Measures
- Dynamic Values: They are calculated based on the data that is currently filtered or visible in a visual.
- When to use them: Ideal for creating aggregated values that summarise your data, like "Total Sales," or "Count of Customers", which could then be filtered to change depending on user interactivity.
- Where they are stored: They are not stored in the data model itself, so they do not increase file size.
- Evaluation time: Calculated dynamically at Query Time when a user interacts with a visual or a slicer.
Tip: Create a dedicated table just for your created Measures
To keep your report organised and prevent accidentally creating measures in the wrong tables or not be able to find them (once you start making multiple measures and you have multiple datasets it can get really confusing), you can create a blank table and add all your measures to it. You can add a prefix to the table name (e.g., _Measures) so it always stays at the top of your list.
Power Query or DAX?
As an aside, it is also important to know when to use M (Power Query) versus DAX, with Power Query being higher up in the OOO. Generally, if a calculation can be done in Power Query, it is good practice to do it there. Power Query transformations are applied earlier in the OOO, and they are generally more efficient for data preparation. However, if you need to reference columns from different tables to create a new column, using a DAX calculated column can be a simpler alternative to a complex Power Query merge.
In Summary
The single most important takeaway is this:
Calculated columns are part of the static data model, while measures are dynamic calculations performed at query time, reacting to user interactions.
By keeping this distinction in mind, you will learn to be able to choose the right one. Use calculated columns when you need a new, row-specific attribute for filtering or grouping. Use measures for powerful, aggregated insights that a user can interact with, change, and explore.