


Ever since I first started working in data visualisation I had been curious as to where data "came from ". Obviously, it comes from an Excel or a database. But how does it get into said place? What is the flow of data from a to be from the collection point to the dashboard? What are the pipes that carry it? In todays task, we planned out how we were going to move data from the mailchimp source systems all the way to a Tableau dashboard.
Step 1:
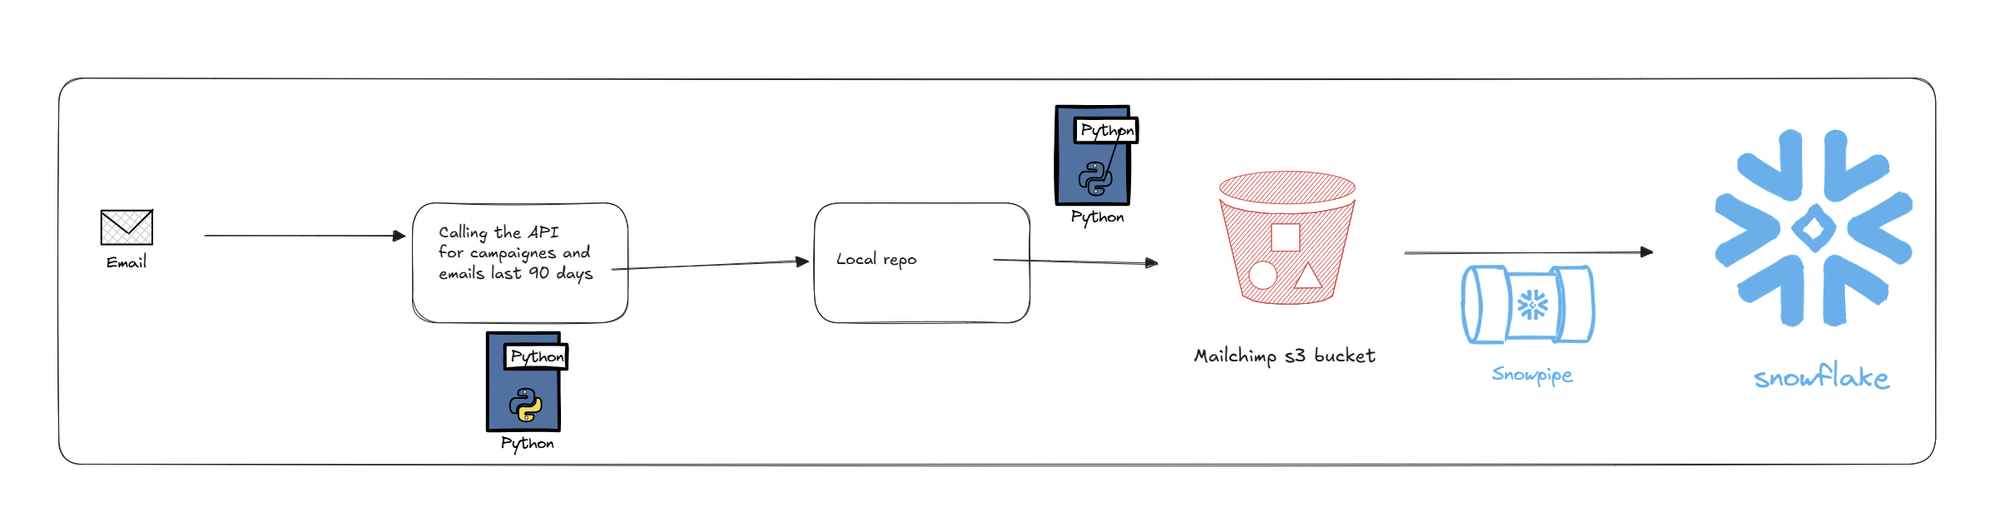
Extract via API callCall the Mailchimp API using a Python script. We extracted the data using a Python script with our secrets safely hidden away in a .env file. This gave us a series of JSON files, which we stored in a local folder.If we have time, we can also include error handeling and logging ie if the API call sucseece give one message; if it fails, check against a list of pre approved fail messages.Step 2: Set up our AWS ecosystem.We need to set up a couple of things inside our AWS system. They are
- Role
- User
- Policy
- Bucket
They will mesh together in order to provide the nessecery permissions in order for us to push from our local file to our S3 bucket.
Step 2: Load to AWS S3 Bucket
We then use a second Python script to load from our temporary file location to an S3 bucket. Again, we stash all of our credentials in an .env file to keep them out of the way. The reason why we want to go for an S3 bucket is that it is a very cheap and very flexible way in which nearly any kind of data can be stored.
Step 3: Set up Snowflake integration
Once we have our data in S3, we need to link it to our Snowflake instance, where we will be able to parse our data and build out our models. If you want to understand the process in more detail, I have already written a blog about it.

Step 4 Snowpipe
Once we have set up out S3 --> Snowflake intergration we can use a snowpipe to automate the procees. We tell it where to look ( our S3 bucket ) and it will check when ever something appears in there. Once it sees something new, it will copy it into our new table.