


Today, we learned about the Gestalt Principle, which focuses on how our brains naturally organize visual information. When I wanted to improve the design of my dashboards, I sought inspiration from Ellen Blackburn's Vizzes. I was particularly impressed by how she created different charts that appeared grouped together. It was fascinating to discover that the key to Ellen's outstanding dashboard designs lies in employing tricks derived from the gestalt principles.
So, what is the principle behind the gestalt principle? Following gestalt theory, structure is created by placing and formatting charts in a way that generates coherence, thereby reducing the visual workload for viewers. Grouping charts together establishes structure, as it allows us to perceive visual elements as a unified whole, making them easier to comprehend.
How do we group charts? Our brains naturally group objects that share similarities. Thus, we aim to make our charts the same size, shape, and format, ensuring consistent structure. Additionally, proximity plays a vital role, as having the charts close to one another within a single pane of view enhances their grouping effect.
Let's consider the first part of my "Makeover Monday" dashboard below.
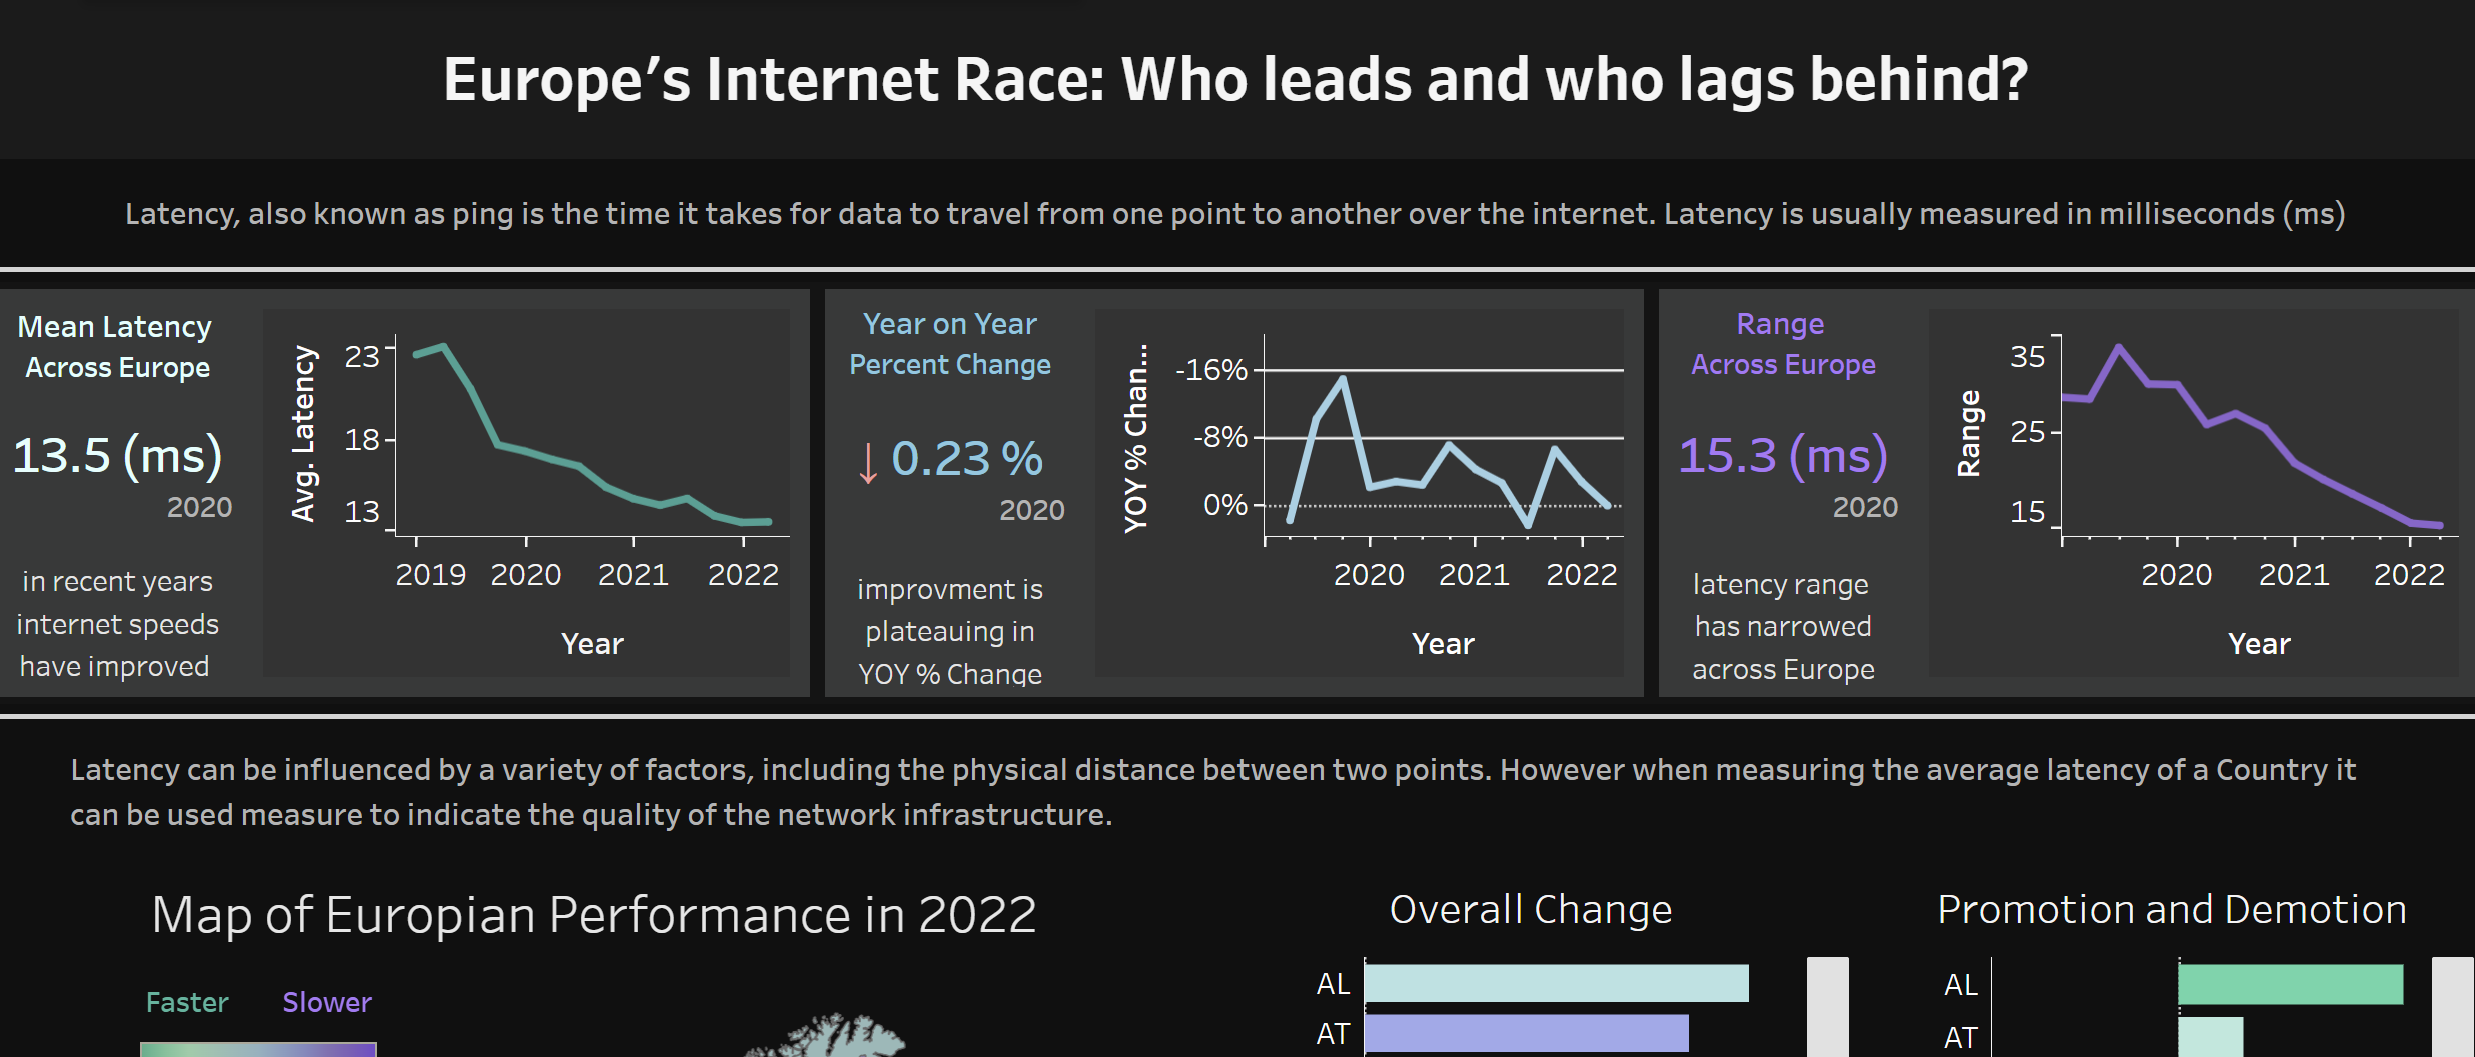
Here, we can observe three distinct line graphs arranged within a single pane of view. They exhibit a very similar structure and format, which creates a sense of cohesion and encourages our eyes to perceive them as a unified structure.
Another effective tool for grouping is the use of enclosures. Our minds perceive objects or elements that are enclosed within a common boundary as belonging together. In this case, the charts and information have been enclosed by shading the backgrounds of our containers. This technique helps them stand out as distinct entities and prevents them from merging into one another. However, they have also been intentionally grouped together. By using upper and lower borders, we have visually separated the line charts from the rest of the dashboard, effectively connecting them.
I'm excited to discover more instances where the Gestalt principle comes into action!