


We’ve had quite an extensive introduction to LODs this week, but I struggled to understand the reason why we would ever want to use INCLUDE. Include & Exclude sit uncomfortably in the order of operations in Tableau, meaning that it can interact badly with filtering within Tableau.
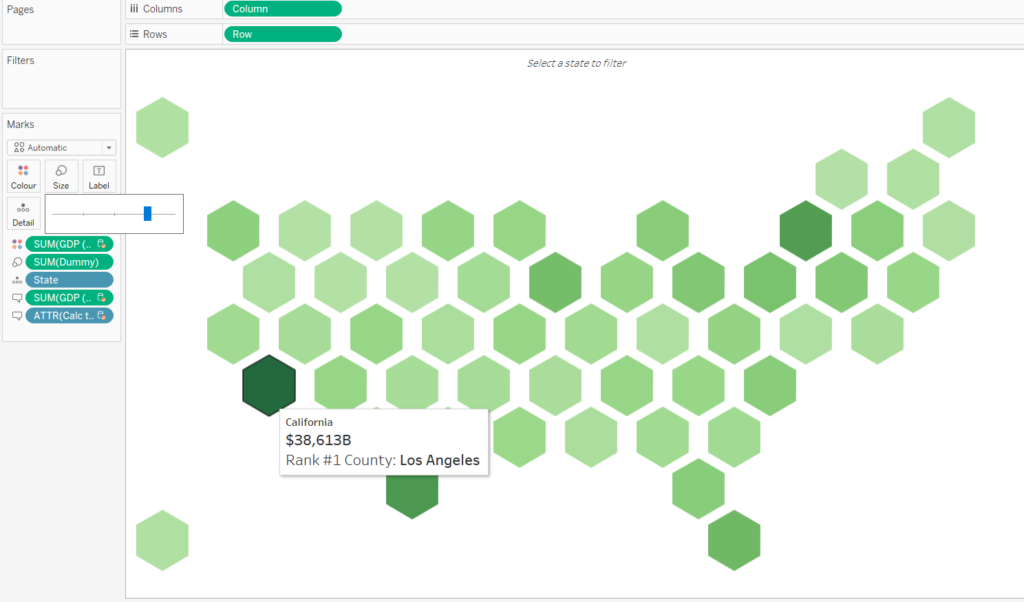
A few weeks ago, I was building a Makeover Monday submission and asked on our internal communications board about a way that I could ‘drill down’ past dimensions in my view. The use case in the Makeover Monday post was: ‘How do I find the City within the state that has the highest economic output?’. In this example, I had a hex-map with States in the view, but I was hoping to return the string value of the city with the highest economic output. For example, in California, Los Angeles (no surprise) was the city with the highest output. I wanted to include it in my tooltip, but I couldn’t work out a way to get it working.
After posting on Convo (what we use at TIL), I quickly received 2 amazing solutions from Erica and Jonathan who showed me some nested, scary looking LOD expressions. They worked perfectly, and I wanted to blog about them, but I didn’t quite get what they meant. But now I (think) I do, so I thought i’d share it with everyone as I found another good use case for it today!
LODs
Level of Detail (LODs) expressions allow us to set the specific level of detail for our desired calculation, regardless of what is inside of the view. This makes them incredibly powerful (if harnessed properly), and offer an alternative to Table Calculations such as ‘percent of total’. I think all of us in DS21 were quite unsure (scared) of them initially, but after a few sessions we’ve begun to see how powerful they can be.
Use Case 1
So, you have a map of all of the states in the USA. You are at the state-level, but you want to find out how you can access ‘city’ level data inside of your view. Specifically, you want to be able to tell your viewers ‘the city with the maximum economic output in this state was ______’.
This is a great way of quickly telling your viewers about some additional information. Lets look at the calculation:
{ FIXED [State] :
MAX(IF ({ INCLUDE [County] : SUM([GDP (Chained $)]) }) = {FIXED [State] : MAX({ INCLUDE [County] : SUM([GDP (Chained $)]) })}
THEN [County]
END)}
My initial reaction to this was probably similar to a lot of people who had never looked at nested LODs before. What is going on?
Lets dissect this. In plain English:
If the GDP (Chained $) from the County/City = the max value for the State then return the name of the County/City
Broken Down:
- Return the max of the following for each State:
- Include City/County in the view and return the total GDP
- If the value from (2.) = the maximum total GDP for each County/City within each State
- Return the name of the County/City
I definitely struggle breaking down LODs. But I think this is probably 2 good ways of looking at them.
Use Case 2
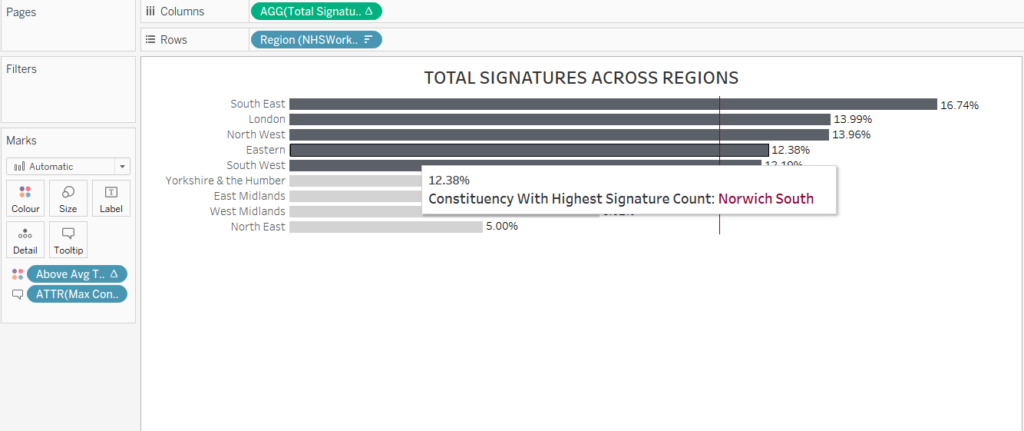
Another example of this was used today, when I was looking at petition data from parliament. I had a bar chart of each region in the United Kingdom, and I wanted to add to my tooltip – which constituency within that region had the highest amount of signatures for the petition?
Since this time I was more comfortable approaching this problem, I decided to demonstrate how the LOD works, with a table that will provide some clearer understanding of what is happening inside of Tableau. Lets look at the LOD
{ FIXED [Region] : MAX(IF (
{ INCLUDE [Constituency] : [Total Signatures] }) =
{FIXED [Region] : MAX({ INCLUDE [Constituency] : [Total Signatures] })}
THEN [Constituency]
END)}

I decided to make a table of this so we can explore what’s going on behind the scenes. If we look at the East Midlands region, we can see how many signatures were received for this petition. The second column shows a repetition of ‘Nottingham East’, which we can see has the highest amount of votes across all cities in the region. This is made clearer by how it is ranked #1 (far right column).
Therefore, we can bring this into our tooltip as an attribute, and it will return Nottingham East, whenever a user hovers over the bar that represents the East Midlands in the initial bar chart shown above!
I hope this blog post has helped people and made them want to explore similar use cases for Include!