


Crosstab in Alteryx is a tool that allows us to transform columns to rows, where the number of rows is indicated by the count of unique values in the column we choose to transform. In Alteryx weekly challenge #219, we use the crosstab feature to allow us to transform different years into separate columns, allowing us to then use a formula tool to solve our problem.
This challenge looks at NYC public school data from maths examinations between 2013 and 2019. The focus is to see how female students in the 8th grade have progressed, looking at the difference between 2013, and 2019, and finding the top 3 districts with the most improvement in score.
This was a relatively straight forward challenge, which only required a few tools, including formula, filter, and crosstab.
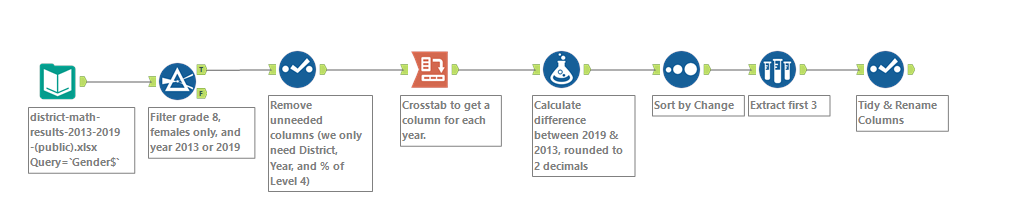
The first step was to filter the data to our necessary conditions, which was to only select female students, who were in the 8th grade, selecting only years 2013 and 2019. The following expression was used to complete this. I used this opportunity to explore the ‘IN’ function, which has found its way into Tableau in 2020.3!
[Grade] = “8” AND [Category]=’Female’ AND ([Year] IN (2013, 2019))
The next state involved removing unneeded columns, leaving us only with District, Year, and ‘% of Level 4’. This then allows us to setup our crosstab tool, where our aim is to get a separate column for each year for every district. To do this, we group by District, set our column headers to Year, and our values will be the sum of ‘% of Level 4’. This leaves us with a transformed dataset which can be seen below.
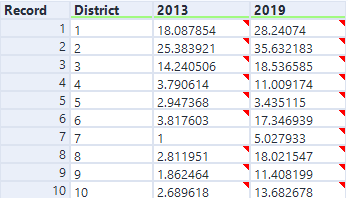
We can now use our formula tool to calculate the difference between 2019 and 2013, and then rounding that value to 2 decimal places, as shown in the output data. Using a sort tool to give us the best districts in descending order, followed by a sample tool to select the top 3 records, gave us the final output.
I really enjoyed this challenge because it was a gentle but effective introduction to using the crosstab tool, which is something I have previously struggled with.