


Thursday was United Nations dataset day and we use the one UN offers regarding the Millennium Development Goals (MDGs), the same they suggest for their Data Visualization Challenge, if you want to participate.
This dataset was a bit less “clean” than the ones from the previous days, so we did some Alteryx preparation first. The main issue was that all the different measures were in the same column of the dataset, with only one additional column with all the values, so we create a workflow using the CrossTab tool, to convert all the different measures from 1 column to N columns, and then join the Population and GDP in 2012 data for each country using previously summarize tools.
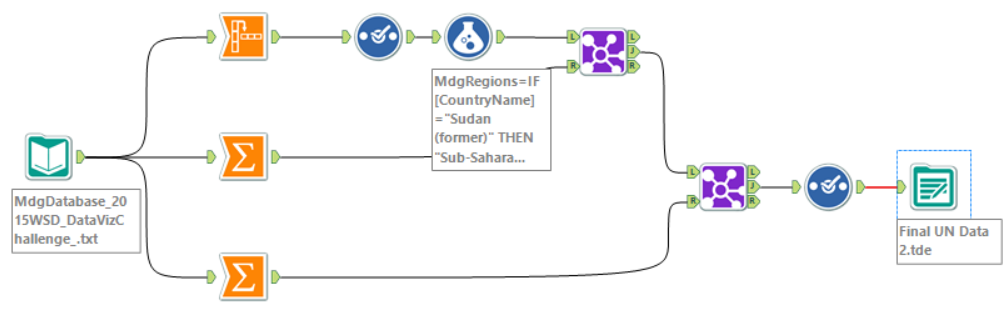
It was a big dataset to work in one afternoon, with all countries around the world and more than 100 measures and different years. With the additional difficulty that not all the countries had values for all years and all measures. After a first analysis of the dataset, I decided to focus on a specific region: Africa, and look for an interesting story to analyze (knowing that data available for Africa is not as numerous as in other more developed areas).
One of the main issues working with African datasets with different years is the big number of nulls that you have, in different countries and different years, so trend likes were only available for a very small number of all the measures, but having the information for almost all the African countries make it possible to look for interesting differences between countries.
With this in mind I finally focused on these topics:
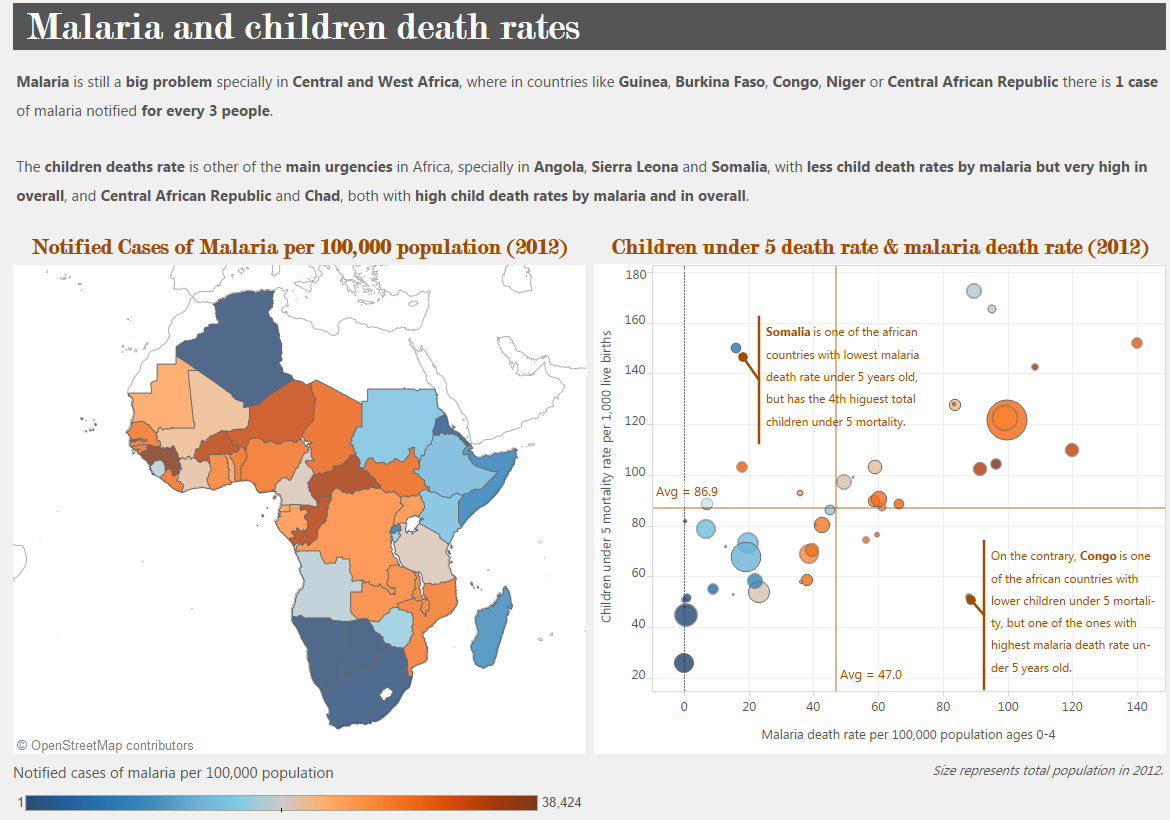
- Malaria notified cases and children deaths rates.
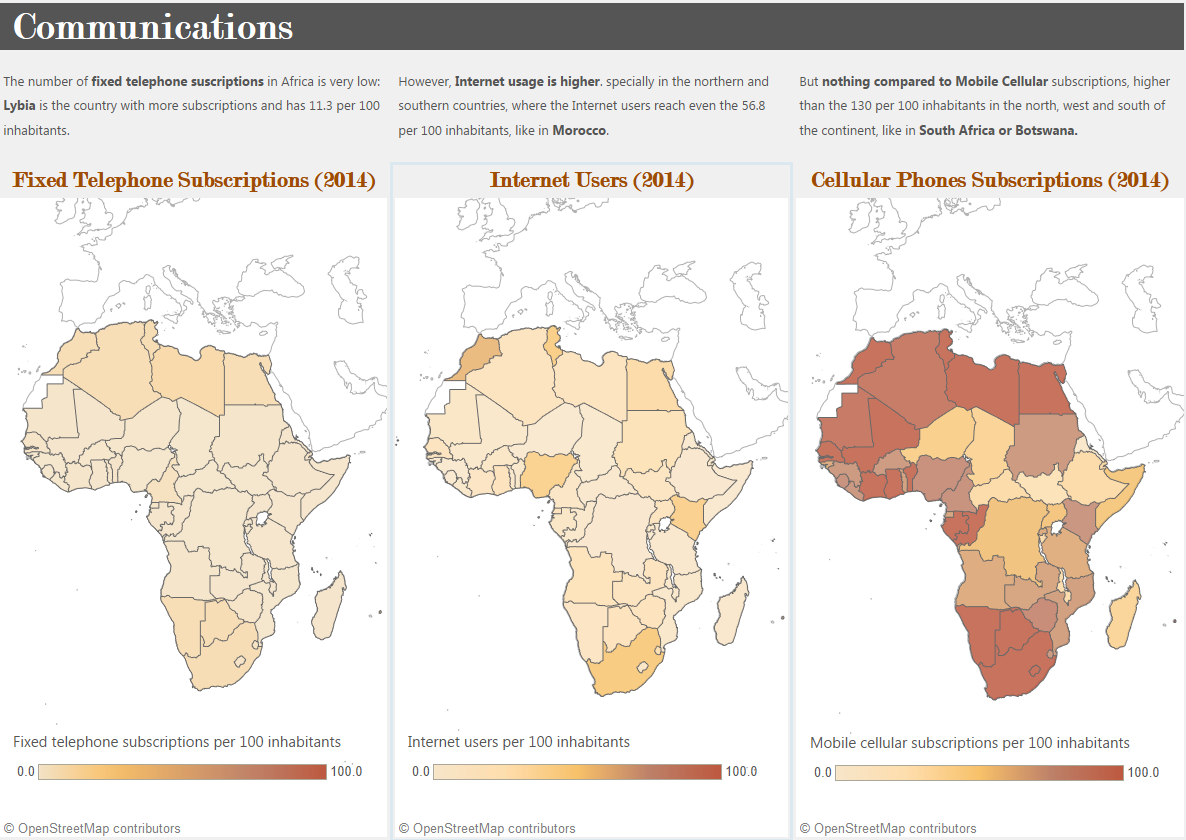
- Communications.
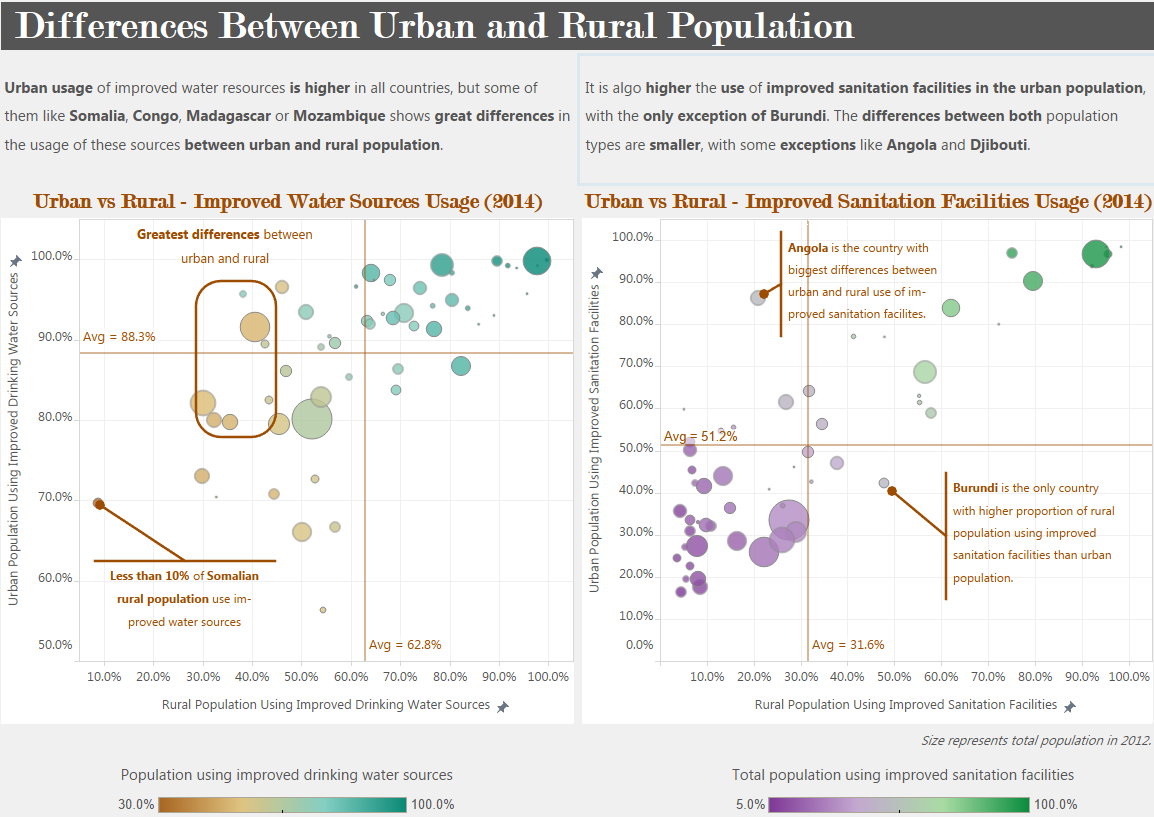
- Improved water sources and sanitation facilities.
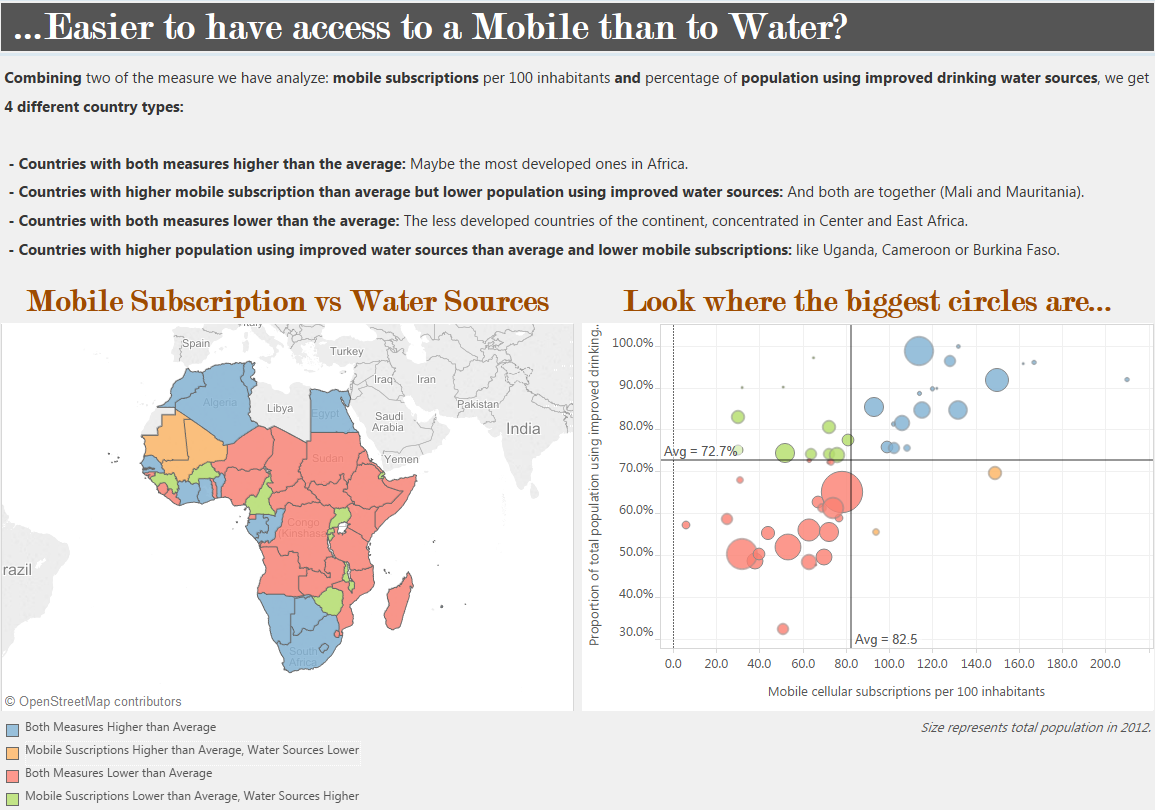
Using maps and scatter plots I discover some interesting facts. Like the low number of fixed telephone subscriptions and internet users in almost all the countries, but a great development of mobile subscriptions.
Or how big are the differences between countries in malaria cases and children under 5 mortality rates.
And even some interesting differences between urban and rural population access to improved water sources and sanitation facilities, with special interesting insights for Somalia, Angola or Burundi.
In two African countries is seems easier or more common to have a mobile subscription than access to improved water sources!
As always, you can see the complete and interactive visualization here and in my Tableau Public Profile.