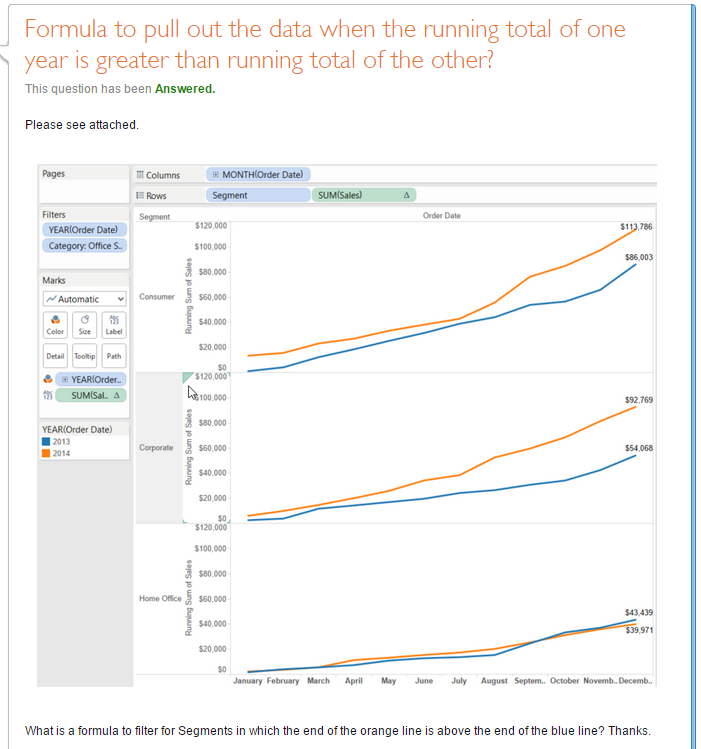
This past week was “Tableau and Alteryx Communities and Forums week”, with the main objective of get more familiar with both communities and try to solve as many doubts as possible of Tableau and Alteryx users. In this post I’m going to share one doubt that I solve and that can be useful for other users. The concrete doubt was this one:

This is my personal solution for this:
- Create a calculated field that gives only the sales of 2013: IF YEAR ([Order Date]) = 2013 THEN [Sales] END
- Create another calculated field with the same structure, but for 2014.
- Drop both Measures in Rows, instead of the Sales Measure and change both table calculations for Running Total.
- Create a third calculated field to calculate if the running sum of 2014 is higher than 2013 (it will be a true / false field): WINDOW_SUM(SUM([2014])) > WINDOW_SUM(SUM([2013]))
- Drop this new field on the Filters Shelf and select the case (true or false) you want to filter, or add it to Quick Filters to manually select the charts to visualize.
Very useful if we want to create a unique dashboard with two different analysis: Pros / Cons, Positive / Negative, Increasing / Decreasing. I hope it’s useful for more people!
