


If you’ve been keeping up with the data school blog so far, you’ll have heard about some of the highlights from our first week: our welcome party, meeting James Eiloart, and a lesson in data analysis from Zen Master Peter Gilks. To reassure you that we are actually doing some work too, I wanted to talk you through some of the tasks we’ve been doing and the things we’ve learned so far.
Before we had even opened Tableau, we worked extensively with paper, post-its and crayons when remaking examples of bad visualisations shown to us by Andy. Having a digital tool to create with enables us to design and iterate at a fast pace, generating many ideas and trashing almost as many before we are happy with a particular idea. Being forced to use crayons to permanently mark the page really makes you stop and think a little harder about your design choices. Even then only after you see the finished product do you really identify things you may want to change or choices that perhaps weren’t the best (for example using a yellow crayon on white paper!).
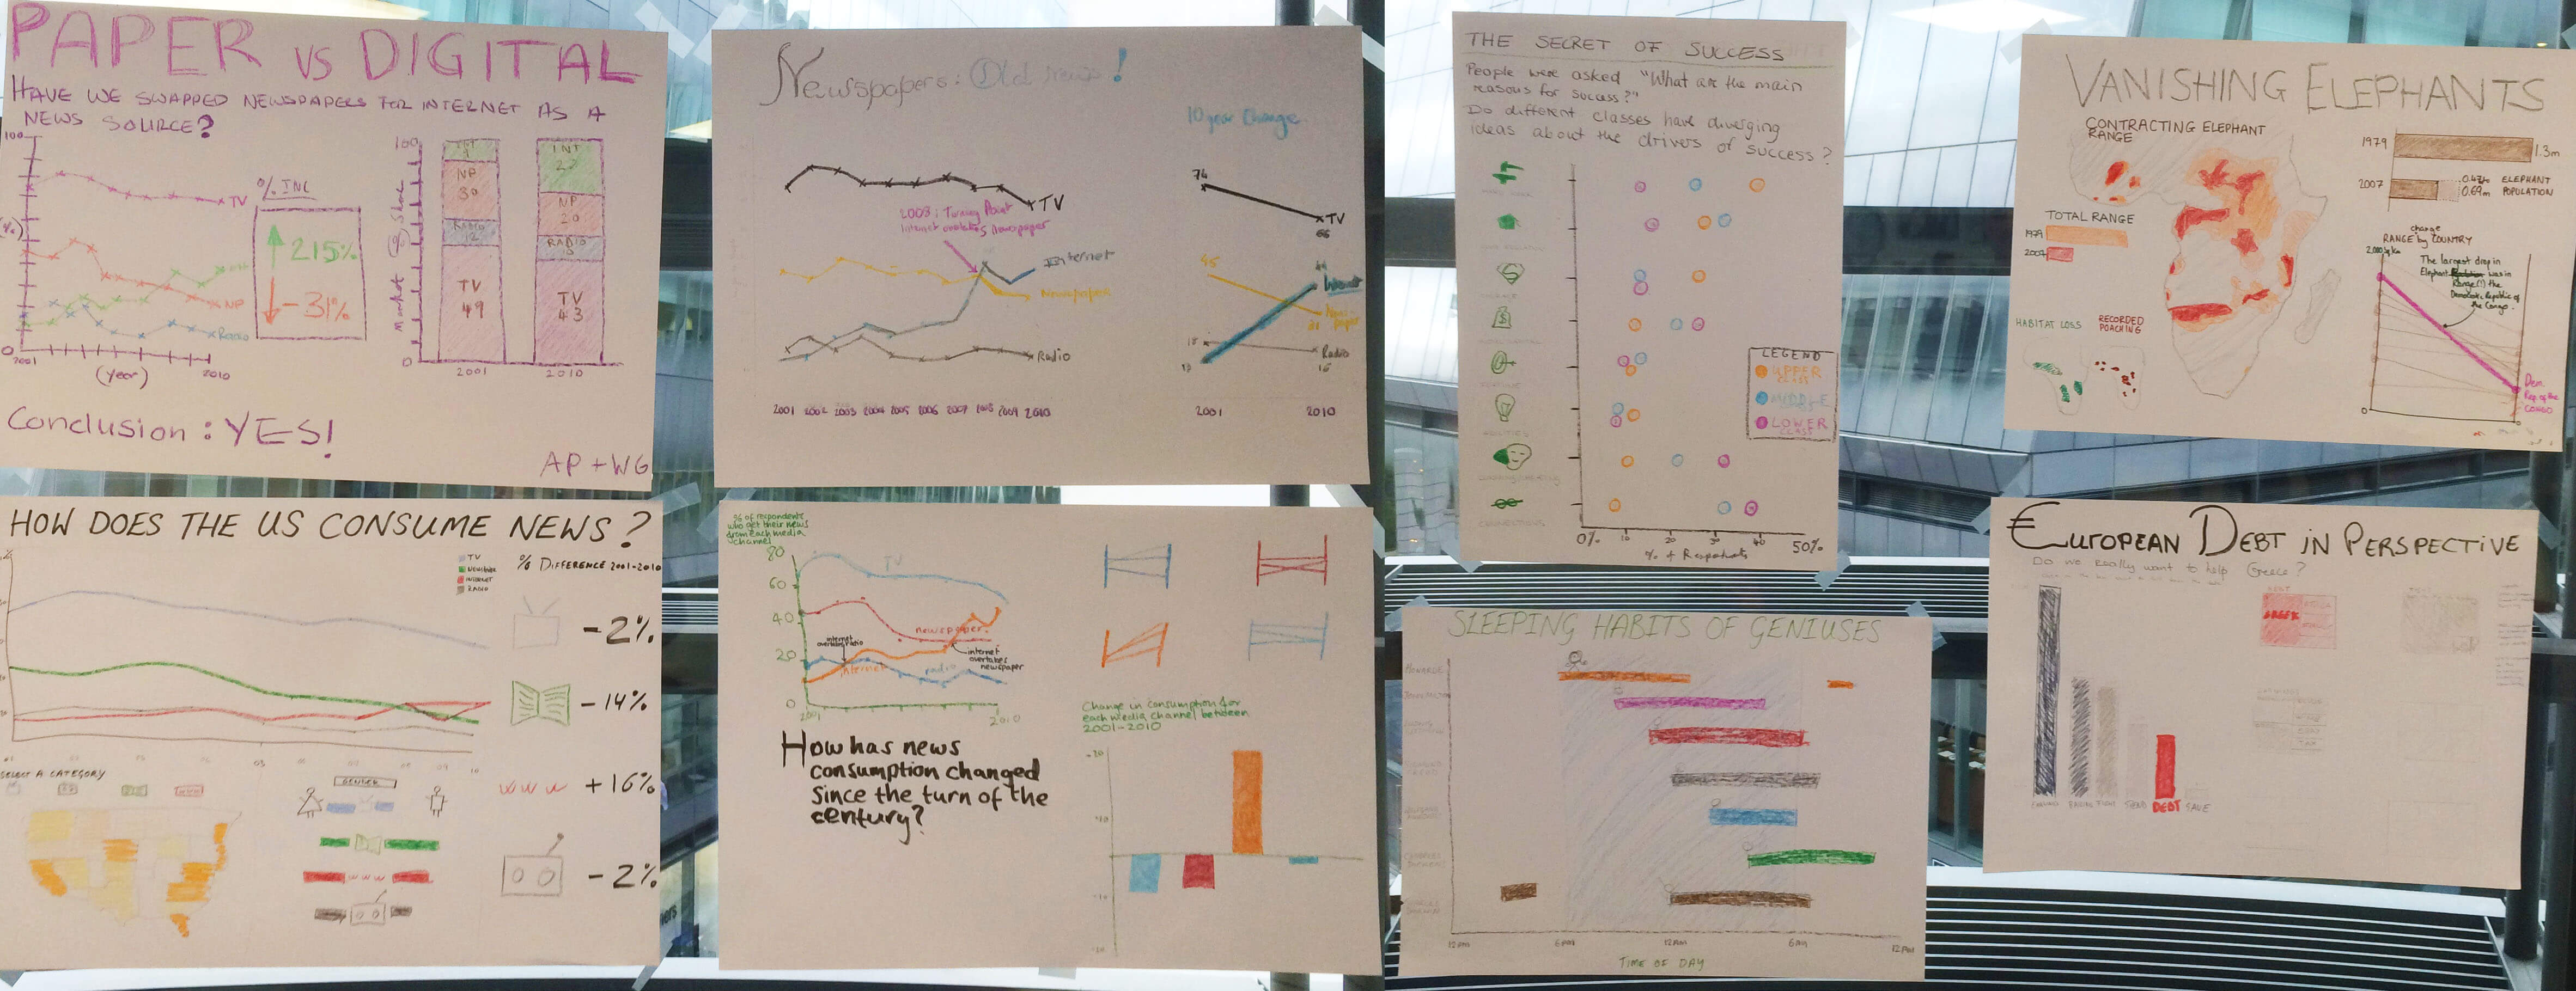
Our Crayon Creations
When it comes to creating in Tableau, we have been sketching our charts ideas on post-it notes and then using these to rearrange potential dashboard designs before playing with the data. This helps you think about the story you want to tell before you start generating 30 sheets of funky charts and lose sight of the information you need to communicate.
We moved on from crayons to begin learning Tableau from the bottom up, starting with the very fundamentals: what products Tableau offers and how they fit together; practical things like the navigation of the Tableau desktop screen and learning correct terminology; then connecting to data sources and creating visualisations. To put these skills into practice, we all started working on Andy’s Makeover Monday (on Wednesday), and submitted our versions to Tableau Public late in the day.
My Makeover Monday effort (click for interactive version)
In addition to Tableau training, Andy also taught us about effective business analysis, focusing on important skills such as asking the right questions of clients, and project management. We continued this theme by creating some sample (crayon and paper) dashboards and doing some research ahead of our week two client project.
My personal highlight of the week was the session Peter Gilks ran with us. Working with the superstore sample dataset, we had 15 minutes to come up with some business relevant analysis that we’d hypothetically present to a CEO or other key decision makers. With the clock ticking, everyone had their heads down, diving into the dataset. Within minutes there were problems – as my sheet names indicate. A certain rogue product had racked up 20 million sales on one day. If you note the product name in the tooltip, Peter’s intentions will become clear. With a few bewildered faces around the table, people gradually started knocking on the table. Very sneaky. Excluding the outlier helped us continue our analysis and we all presented some findings.
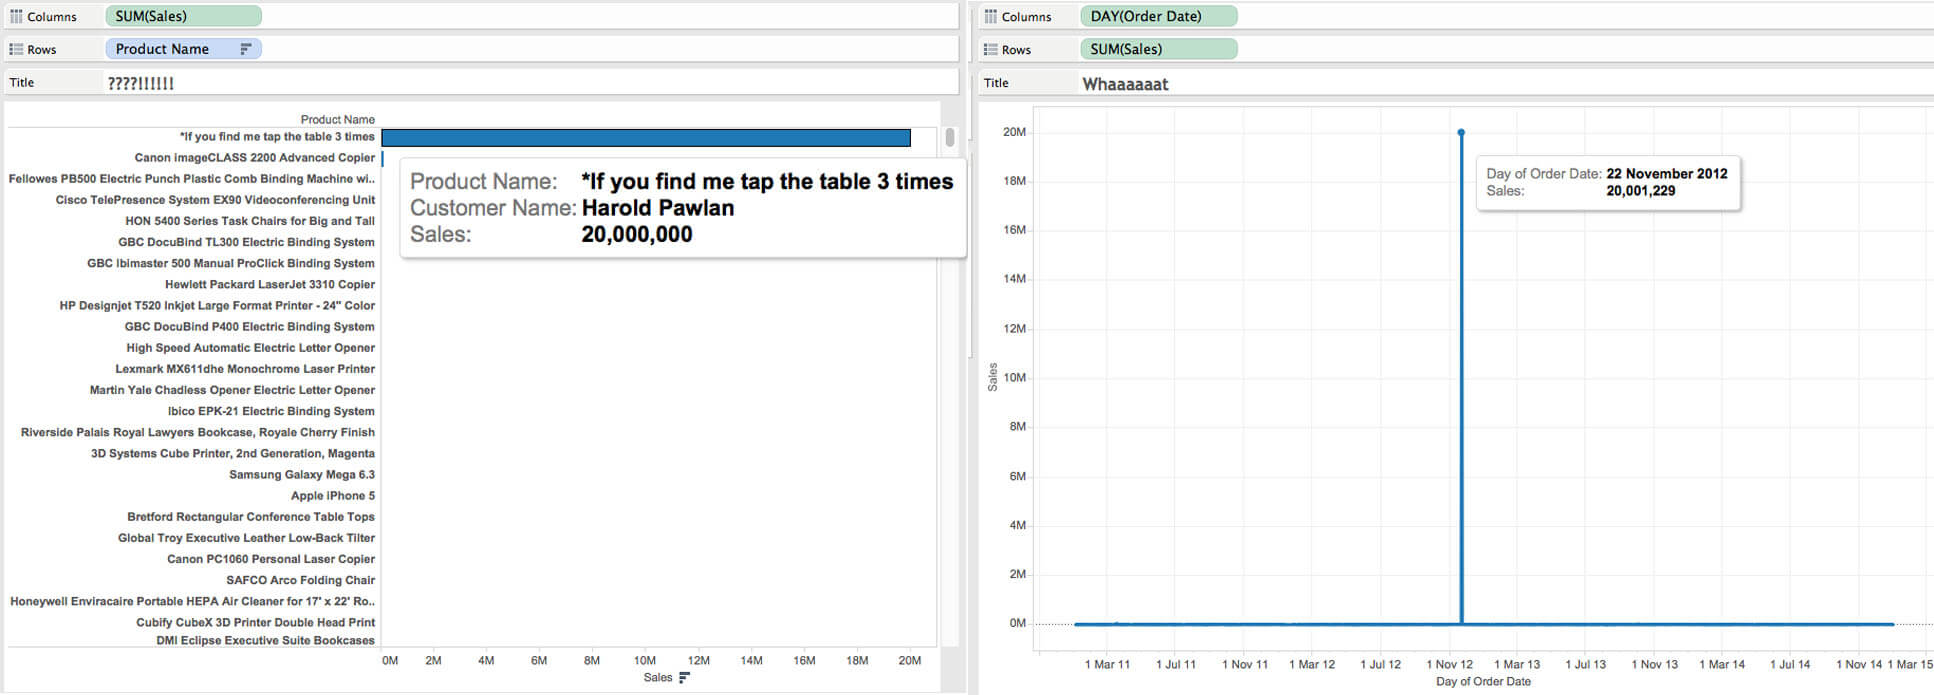
Something is not right here!
Unfortunately, all of our findings were wrong. Completely wrong. For example, my disturbing finding that a customer had been given 140% discount on some of her orders was due to the fact that Peter had duplicated every row of the database! In the hurry to find insights we’d all overlooked basic checking of the data integrity, which should be the very starting point for any analysis. Learning a lesson like that is invaluable and it has probably saved me a good few hours even days of wasted effort in my future career.
Our final piece of work was to complete a makeover of the viz we used as our original application to the data school, and present it back to the class, with people dialling in on webex to watch. Helpfully, Andy posted the link to this webex on twitter so our audience was not only the people in the room and people in the wider business but also an unknown quantity of people from the data viz community. Nerve-wracking, certainly, but rewarding, totally. All in all: a great start to what promises to be a fantastic job.