


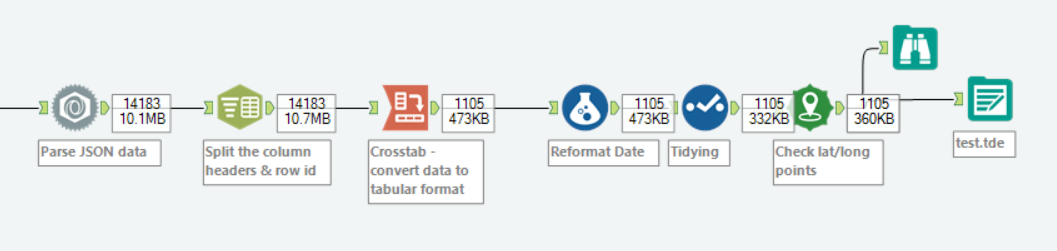
Continuing from my previous post, where I retrieved crime data using an API, we will now look at the process I used for preparing this data for Tableau. The end goal is to be able to plot the location for each crime in the dataset and be able to see detailed information for each point. In the last blog post, we had built the API query and downloaded the JSON formatted data in Alteryx. At this point, all data that we wish to see is contained in one cell, so this needs to be parsed out using the JSON Parse tool, specifying that our data is to be found in the ‘DataDownload’ field. Easy!
![]()
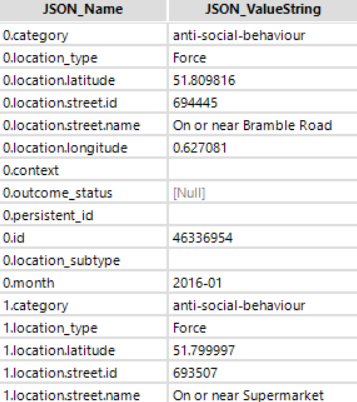
Now we have to figure out how the data needs to be split further. Look at the JSON parse tool output, and you’ll see that the field headers seem to be repeated and the number that precedes the headers represents the row number. First, split this information into two columns using a Text to Columns tool. Then, use a Crosstab tool to shift this information into a readable table that Tableau can work with.
Now the data is looking more recognisable, we can use the select tool to do some basic clean-up: clean up the dates, convert some strings to numbers, and select the relevant fields needed for our tableau output. Using the Create Points tool to map out the latitude and longitude data we can check that the points are mapping as expected with a Browse tool. It’s all looking good so the next step is simply to output to .tde and the data is ready for tableau!
Chucking the data into Tableau is the best way to asses whether we’ve achieved our what we set out to or not. We’ve managed to map all crimes from the API output and provide further detail for each crime mapped. So far so good. Next time we’ll make the workflow into a user friendly app by defining ways for the user to input values that affect the data provided in the output. Stay tuned.
