


Filtering is super useful in Tableau. We can organize and simplify our data with it and we like that.
There are 6 different type of filter options:
- Extract Filter
- Data Source Filter
- Context Filter
- Dimension Filter
- Measure Filter
- Table Calculation Filter
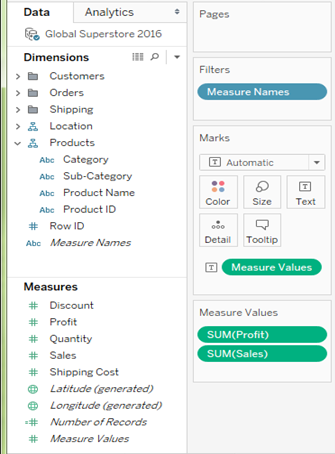
A measure filter (always green) can filter the data based on the values present in a measure. The aggregated measure values can be used in measure filter to modify the data.
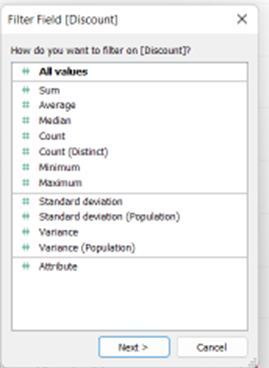
When dragging it on, Tableau will ask you how you want to filter – in other words, what aggregation to use (Sum, Avg, Median, Standard Deviation, etc.)
The second step will give you four options: Range of values, At least, At most and Special.
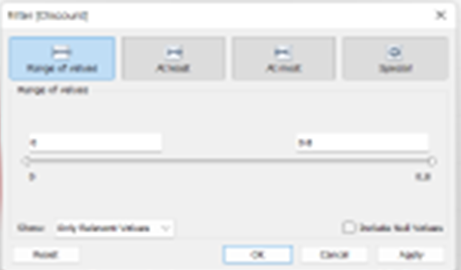
Range of Values: Maximum and minimum range of measure value can be given and filtered
At Least: A minimum value to a measure is given to filter the data
At Most: A maximum value to a measure is given to filter the data
Special: An option to select null or non-null values and filter the data
If we want to filter categorical data, we use dimension filters (always blue) or non-aggregated filters.
After dropping one of the dimensions and drop it into the filter mark the following window should pop-up:
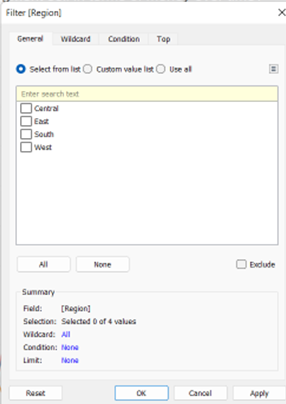
· General: Use the General tab to select the values you want to include or exclude.
· Wildcard Use the Wildcard tab to define a pattern to filter on.
· Condition: Use the Condition tab in the Filter dialog box to define rules to filter by.
· Top: Use the Top tab in the Filter dialog box to define a formula that computes the data that will be included in the view.
Peter Hajnal DS | 33