


Reference line:
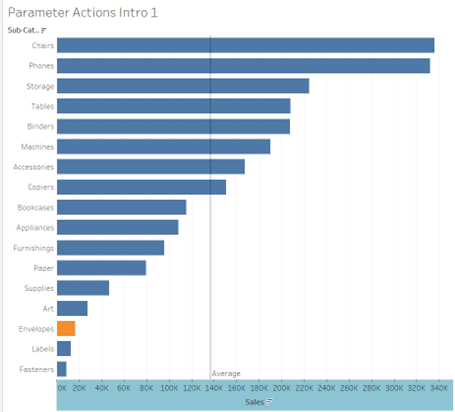
It’s a line that gets drawn on a chart that represents another measure or point of reference. Reference lines can be useful in providing context to the related chart. For example, a line showing the average will visually show the difference of each mark in the chart relative to the average.
To Add a reference Line, there’s two ways:
1. Right click on axis and click on Add reference line
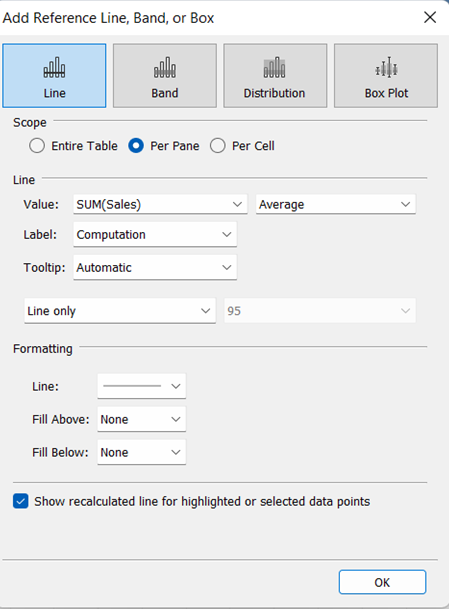
Out of the 4 options, click on Line. Then we have an option to change the values depending on what measures we’d like to see. Next to the value we have further option:
· Total
· Sum
· Constant
· Minimum
· Maximum
There’s also a few formatting to make it visually more appealing. Good option when we present our viz in a larger room and lines are harder to see to use the are below or above option.
2. We can also add reference line from the Analytics pane
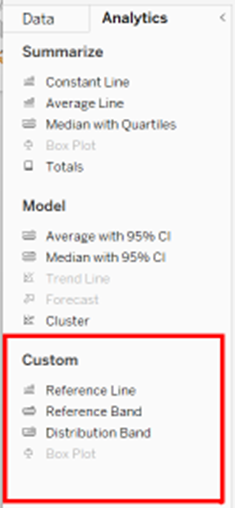
After clicking on it the same panel (see above) will pop-up.
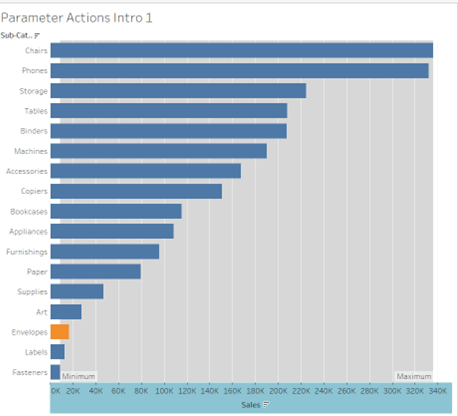
Reference band:
Reference bands are shaded areas behind the marks in the view between two constant or computed values on the axis. You can add reference bands to any continuous axis in the view. To add a reference band: Drag Reference Band from the Analytics pane into the view. Tableau shows the possible destinations.
Peter Hajnal DS | 33