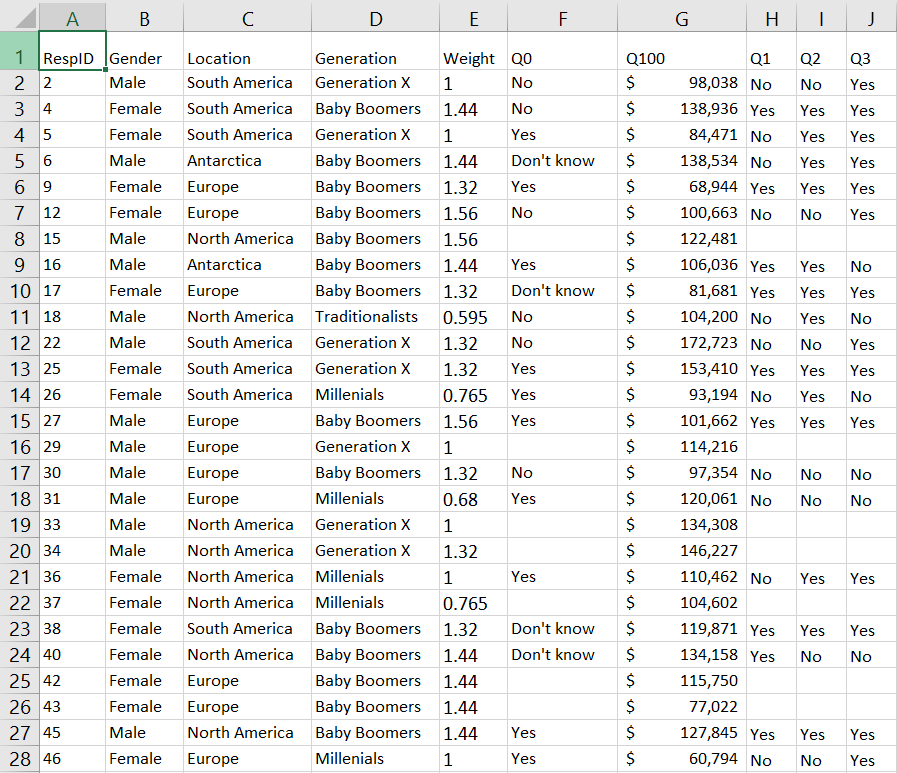
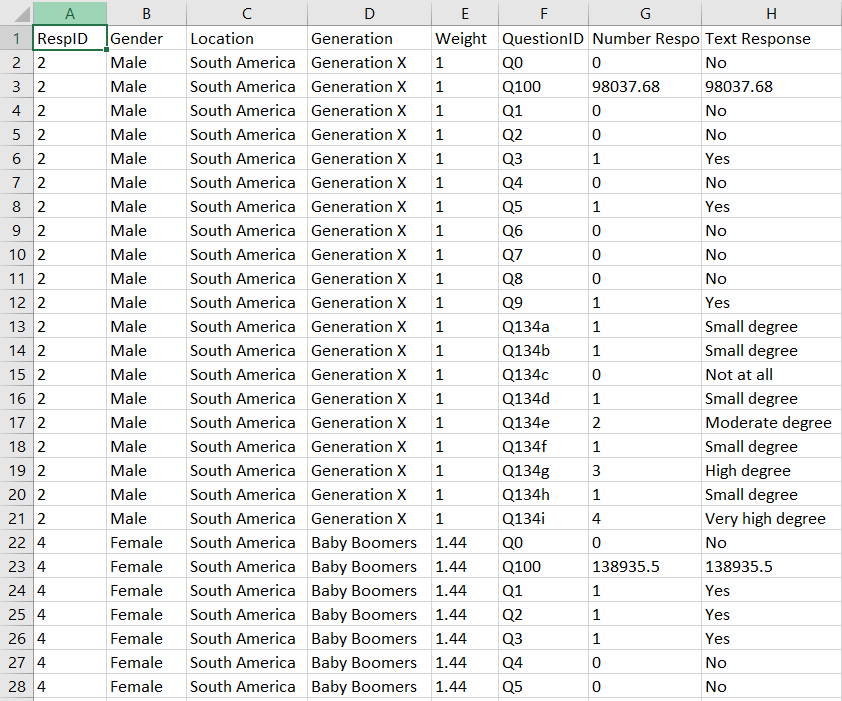
Tableau is an excellent tool for analysing survey results but before we can dive into visualisation we will often have to reshape the data set into a format that will play nicely in Tableau. Survey tools will usually output results in a one-row-per-respondent format with a different column for each question. This results in data sources that are “fat and wide” and will cause difficulties when we are trying to analyse in Tableau. We must therefore reshape our data in a way that reduces the number of columns by creating a single ‘question’ column and a separate row for each unique question to create a “tall and thin” data set.

Short and Fat

Tall and Thin
For users working with survey data on a regular basis or highly complex data sets the best way to prepare your data would be with a workflow in Alteryx. However, more simple data in CSV or Excel format can be reshaped relatively easily within Excel using the Tableau Add-In for Reshaping Data.
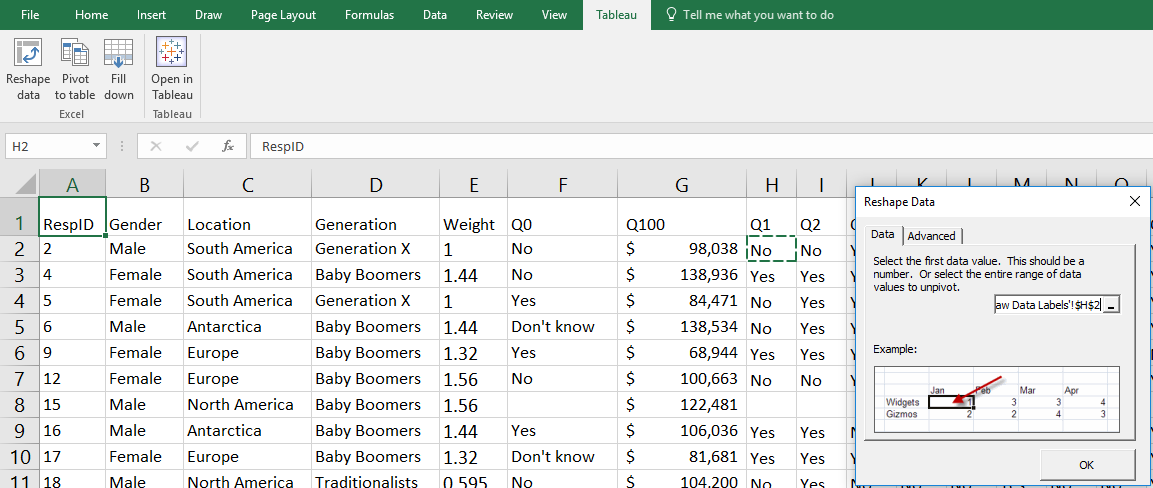
Installing the add-in for your version of Excel creates a Tableau tab in the menu bar with a ‘Reshape data’ button that transposes the data automatically based on the field that you select. Any fields that you will want to filter by, such as demographic information will need to be to the left of the cell that you select to pivot on. In the example below we want to keep the information in columns B to G linked to the Respondent ID so we chose for the data to be transposed around cell H2. This will create a new sheet in Excel which is set up perfectly for analysis within Tableau.

Click here to download the sample workbook
