A testing “Dashboard Week” at The Data School culminated in creating a visualisation of Mr Andy Kriebel’s marathon training. This post explains how I mapped out his runs in my viz shown here,
The first thing I notice is that the DateTime field runs from 21/07/2015 19:16:09 to 20/04/2017 06:15:10 for every second that Andy runs. Therefore if we plot the latitude (always on rows) and longitude (always on columns) for every second of DateTime we get,
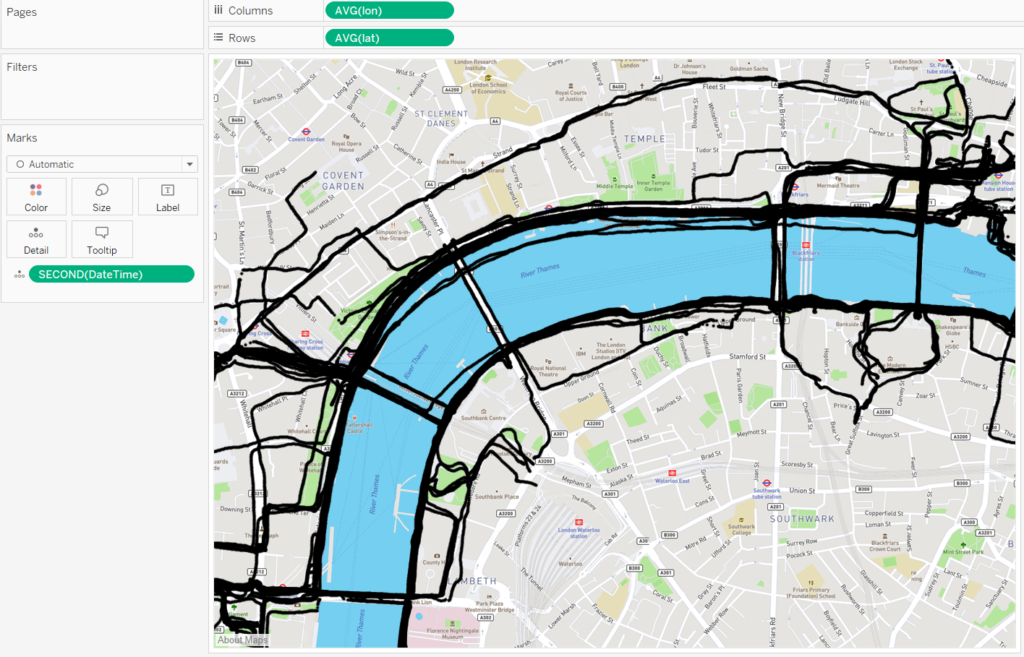
Showing every single run that Andy made in the last year. If we aren’t interested in displaying every run simultaneously, we can filter by the day (assuming that Andy only ever runs once in a single day). Filtering by discrete ‘Month / Day / Year’ allows us to select just one day, and we end up getting something more intelligible,
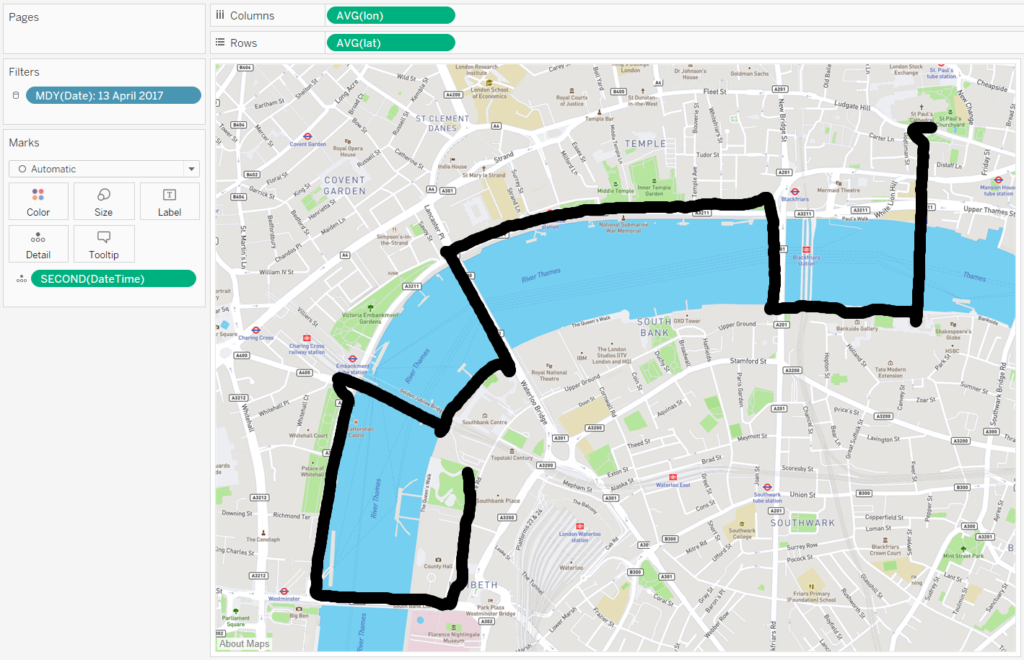
Show the filter to be able to select each run with a single click. The automatic marks card may have selected ‘circle’. It makes more sense to change this to ‘line’. However doing so seems to join up each (latitude, longitude) point by ascending longitude. To remedy, drag Second(DateTime) (or exact Exact Date of DateTime – as long as it’s the most granular time increment) to path. This should join the dots in the correct order.
Fantastic! But we can still make our path look a little more interesting using a dual axis. Once again, drag the ‘lon’ pill to columns next to the original. You should see two maps side by side. We can change the mark type of each individually. Locate the marks card for the second map titled something like AVG(long) (2), remove anything on the detail shelf and change the mark type to ‘circle’. Notice that only a single point appears. If your aggregation of latitude and longitude, it will be dead centre like so,
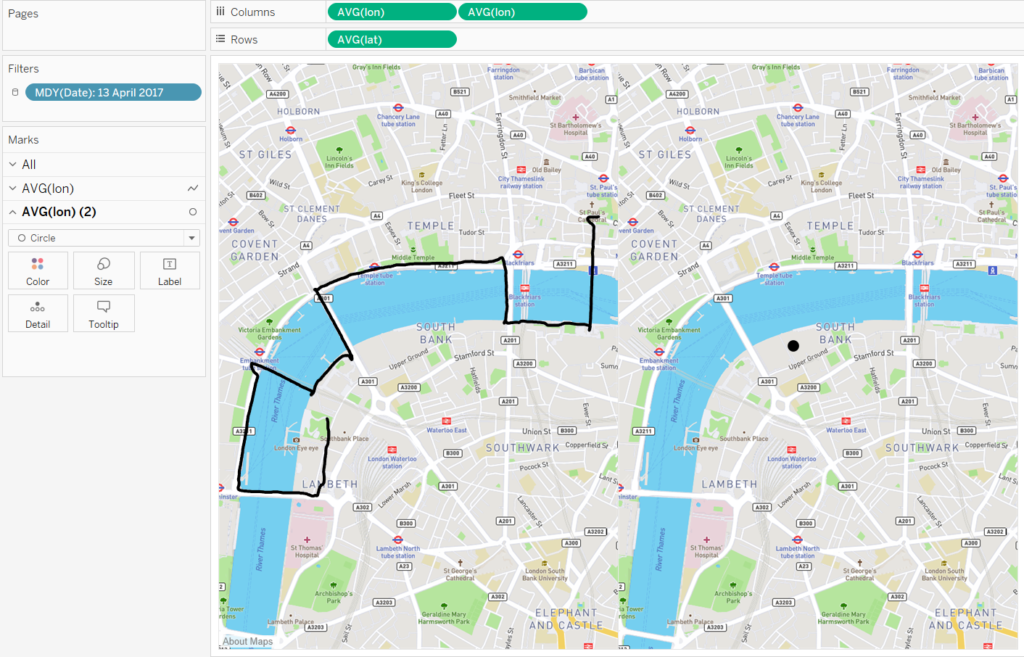
We can choose which points on the map are represented by circles by our choice of detail. For example, we could simply choose Minute(DateTime) as Detail and we’ll see the latitude and longitude at each minute,
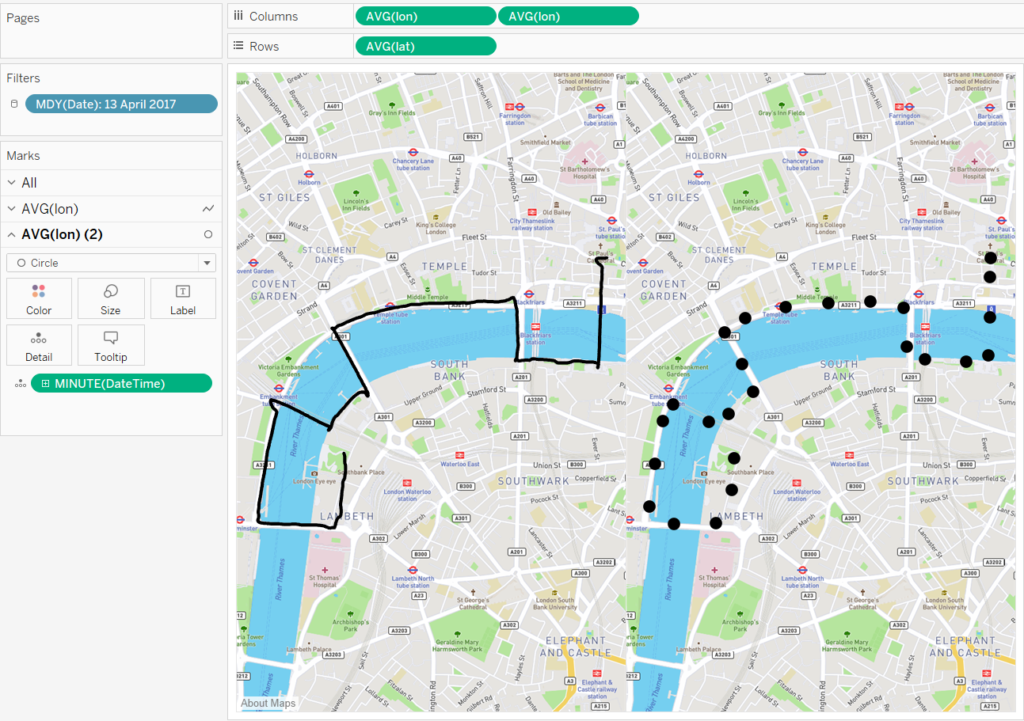
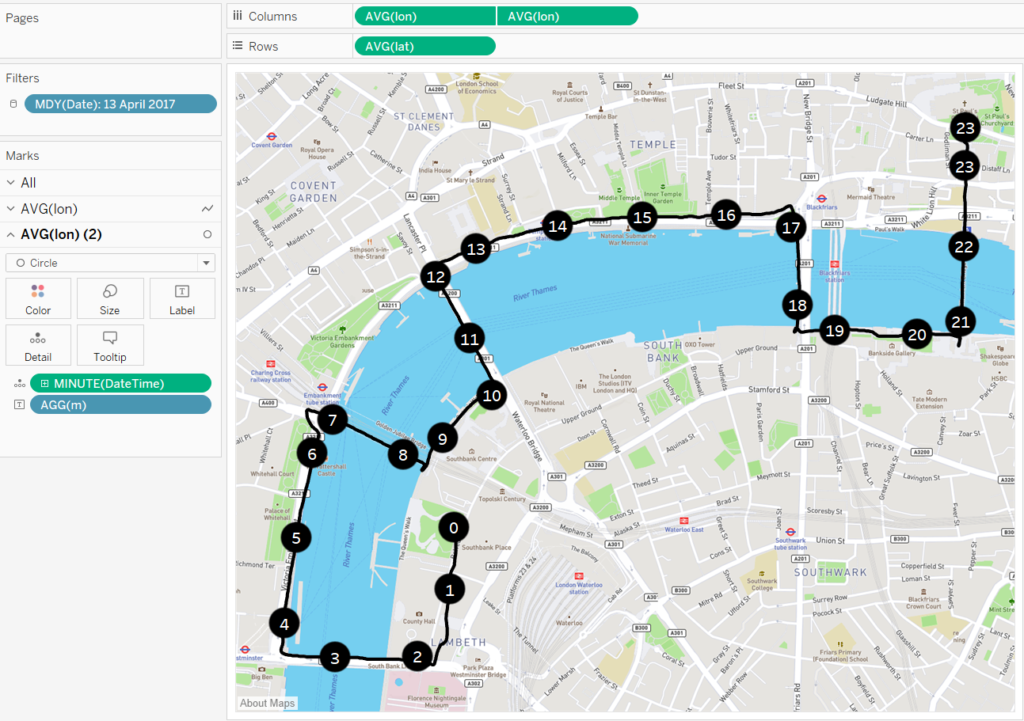
Now right click on the second AVG(lon) pill and select dual axis. The axes should already be synchronised when using latitude and longitude. I have a RunTot_Duration field which shows the number of seconds ran. So I can create a calculated field: STR(FLOOR([seconds] / 60)) – which gives the number of minutes – and drag this to text to get,
However, it makes more sense to have mile markers than minute markers. And this is slightly more involved. The detail for minute markers is simply MINUTE(DateTime). But the detail for mile markers is not MILE(Cumulative Distance) as the function MILE does not exist. Nor is it FLOOR(Cumulative Distance) or ROUND(Cumulative Distance,0) or INT(Cumulative Distance). Although these calculations do plot a point for each mile, that point is the average latitude and longitude for all cumulative distances that end up being curtailed to a single integer,
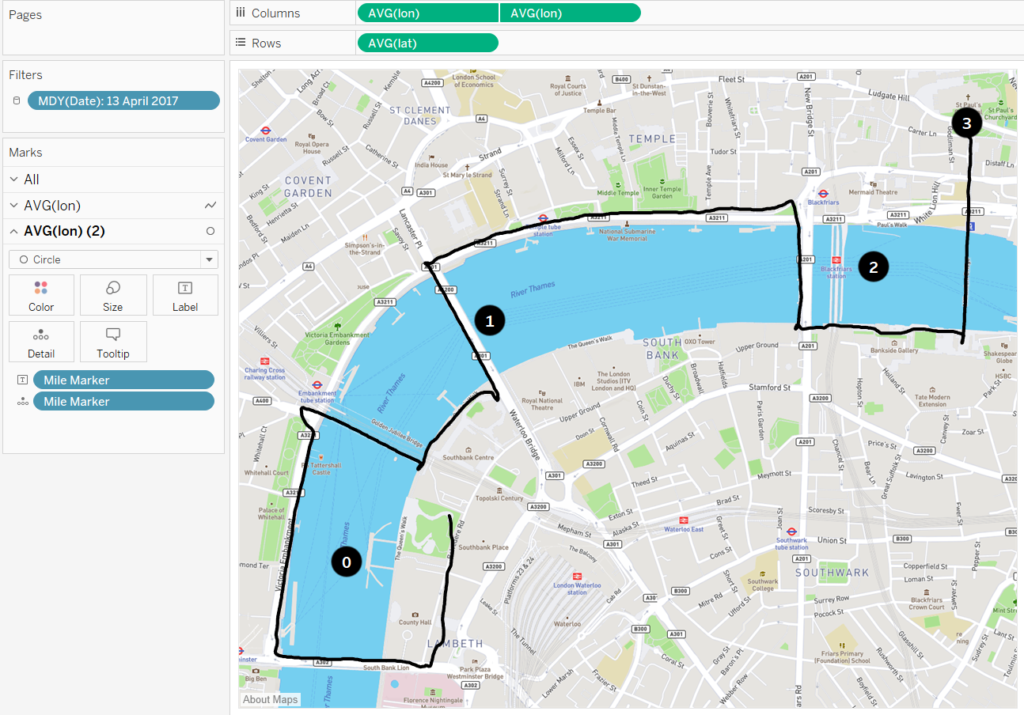
And this is not what we want. A calculation that uses and IF statement to specify just the integer points is necessary. Unfortunately something like,

Won’t work because the cumulative distance doesn’t fall on an integer number of miles and, apart from the very first point, has trailing decimal places. My workaround is to use a conditional statement that returns true when the points are ‘almost’ integer. I use the calculated field,

And we get,
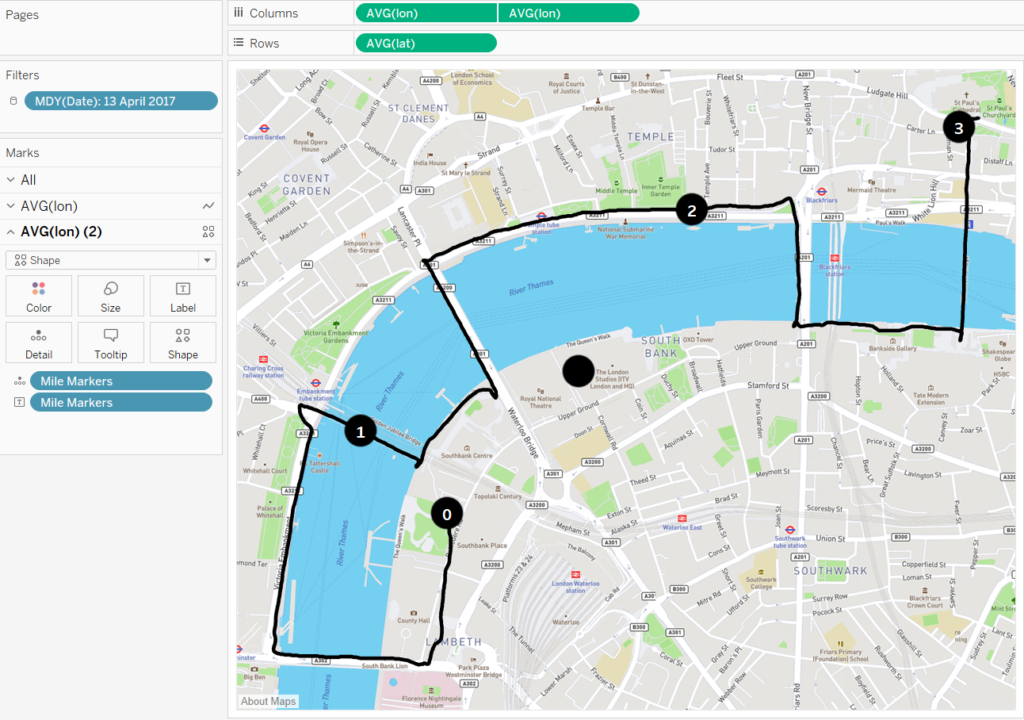
You may notice that you now have an irritating extraneous point on your map with no mile indicator (circled). Get rid of this by dragging the Mile Markers to ‘Shape’ on the marks card. A card should appear showing the shape associated with each mile. The culprit is the NULL point (one that didn’t satisfy our condition). Right click on the NULL value on the marks card legend and select ‘Hide’, or alternatively assign it a blank icon. You can also assign your own shape. I created my own balloon for the mile markers which I’ve assigned for all miles 1 through to 26. The end result is,

Here I’ve also created a parameter to switch between the colours showing pace or speed, reduced the colour range significantly to reduce the white and increase the amount of orange and blue in the colour scale, used my own balloon icons I created in Adobe Illustrator, formatted the text in Adobe Illustrator to look like the Runkeeper logo (representing the A and K as laces) and formatted the Time and Average Pace numbers to ‘hh:mm:ss’ using FLOOR and modulus (%) functions.
Any question please comment below!
