


The custom admin views allow all administrators on Tableau Server the ability to see the server’s usage statistics. To see the original ‘uncustomised’ admin views,
- login to your server
- select the site name at the top of the screen to reveal a drop-down box.
- Then select Manage All Sites.
- Click on Status
- Scroll down to Analysis.
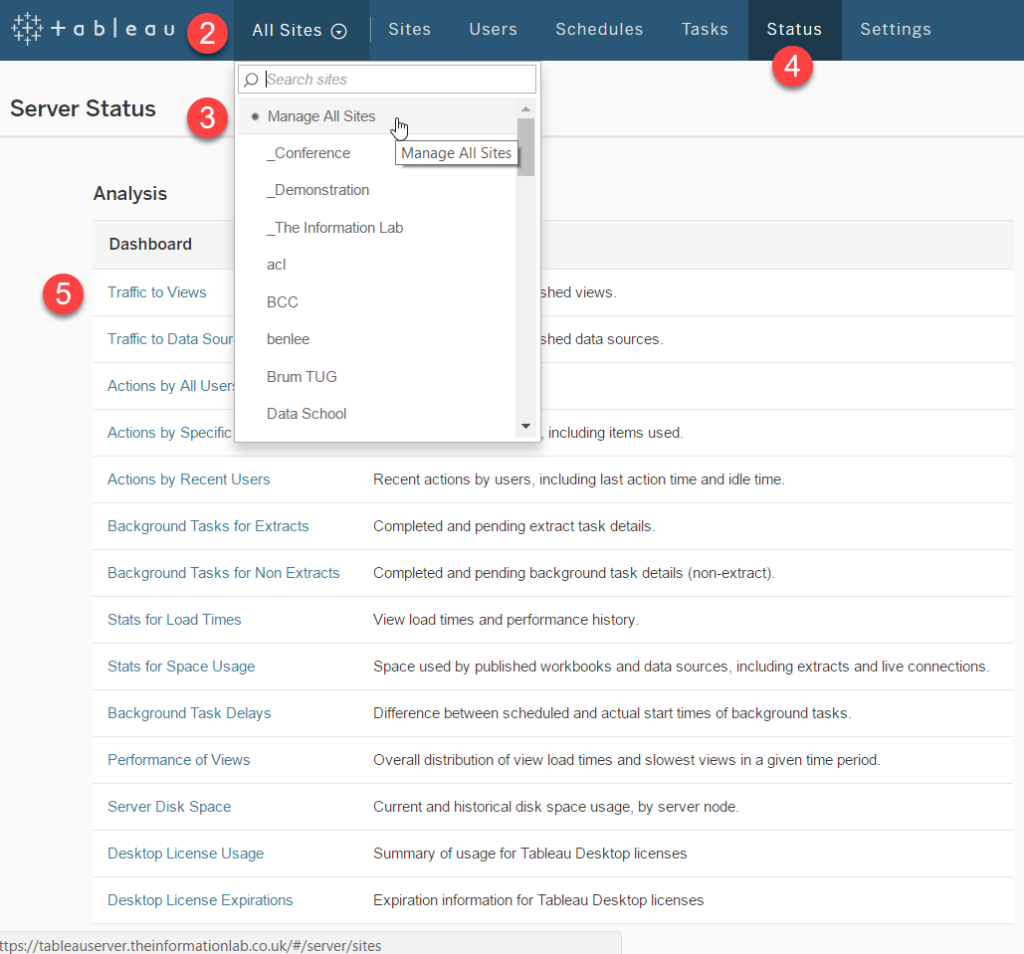
Here we can see links to various dashboards that provide usage statistics and can be very useful in dictating how a company uses their Tableau Server. It can inform on a wide variety of things from which licences for Tableau Server are being wasted on users who don’t use it to monitoring performance, etc, etc. This analysis is fine and you get some interesting insights into the data provided. However, it is often the case that you a) have a very specific question that you want answering and would like to customise the charts and tables to cater to your needs and b) would like to give the inbuilt admin view analysis a bit of a makeover and the make those graphs look a little prettier.
This can be done, but first you need to enable access to the Tableau Server Repository. To gain access to the Tableau Server Repository we use the tabadmin command-line utility to open up access to the database repository (it is closed by default). Remote Desktop into your server, open a command prompt and then use the command,
tabadmin dbpass –-username readonly Password123
where the username is always readonly and the password is any appropriate choice. NB: The username can also be tableau for a more limited subset of the data…which doesn’t interest us.
Now we have opened the database repository on the server, we can connect to this datasource through Tableau Desktop on our own computers. Open up Tableau and connect to the server using PostgreSQL (pronounced “post-gress-Q-L” – to save you any massive future embarrassment), which allows us to query the tableau repository database. A window pops up and we need to enter some credentials to gain access,
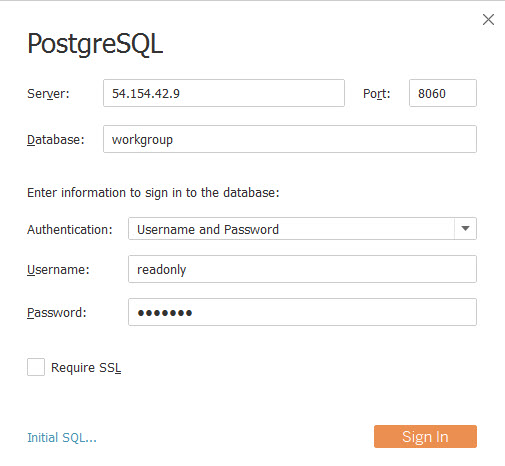
The Server is the IP or URL address of where your server lives. The port number is always 8060, the Database is always workgroup, the Username is always readonly and the Password is whatever you set it to earlier when you (or IT) ran the tabadmin dbpass command. If you are having problems connecting, it’s a good idea to check that Windows Firewall isn’t blocking your access. If you’re successful, you should see the view shown below,
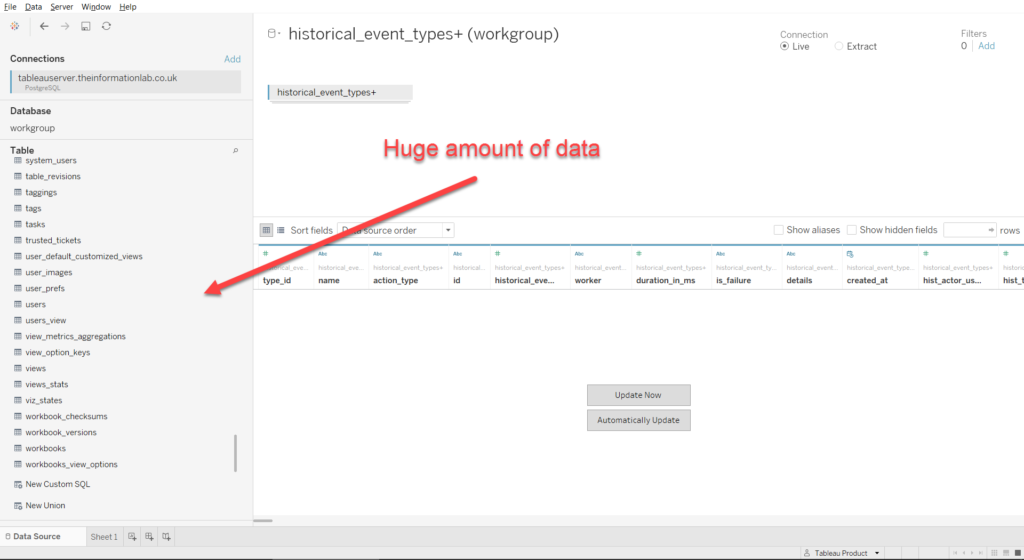
Once connected you should see that you have access to a tonne of data – approximately 170 tables. You can now start having fun creating dashboards that show how Tableau Server is used within the company. To get you started, if you drag historical events and historical event types in to the window then you should get an automatic inner join. Go to Sheet 1, drag action type to rows and name after that, and then date to columns. These are all the historical events that have taken place on our server. This is incredibly powerful dataset to see what’s going on, who’s logging in, who’s publishing stuff, who’s creating projects and when all these things took place. Each row represents an event and should make for some very interesting vizzing – and material for a future blog post. Enjoy!
NB: if you want direct access to the admin views, but in your own copy of Tableau desktop, then you can get access to this file hidden deep in the Tableau Server directory. First you need to access the server by typing localhost into a browser, login and navigate to the standard admin views. Then look in C:\ProgramData\Tableau\Tableau Server\data\tabsvc\temp and rename a file called tabbedadminviews so that it has the extension ‘.twb’. You should then be able to access it on your Tableau Desktop with the same dashboards presented on the server. Russell has written about this process here.