


The first week has flown by in a whirlwind and rather than feel more confident in my abilities, it’s served to identify how much there is to learn; my conscious incompetence is illustrated in the (XKCD inspired) image below. This is exacerbated by the plethora of new software, apps and online accounts to familiarise myself with, an exhaustive list of which would fill the rest of this blog.
The first week has flown by in a whirlwind and rather than feel more confident in my abilities, it’s served to identify how much there is to learn (see XKCD inspired image below). This is exacerbated by the plethora of new software, apps and online accounts to familiarise myself with, an exhaustive list of which would fill the rest of this blog.
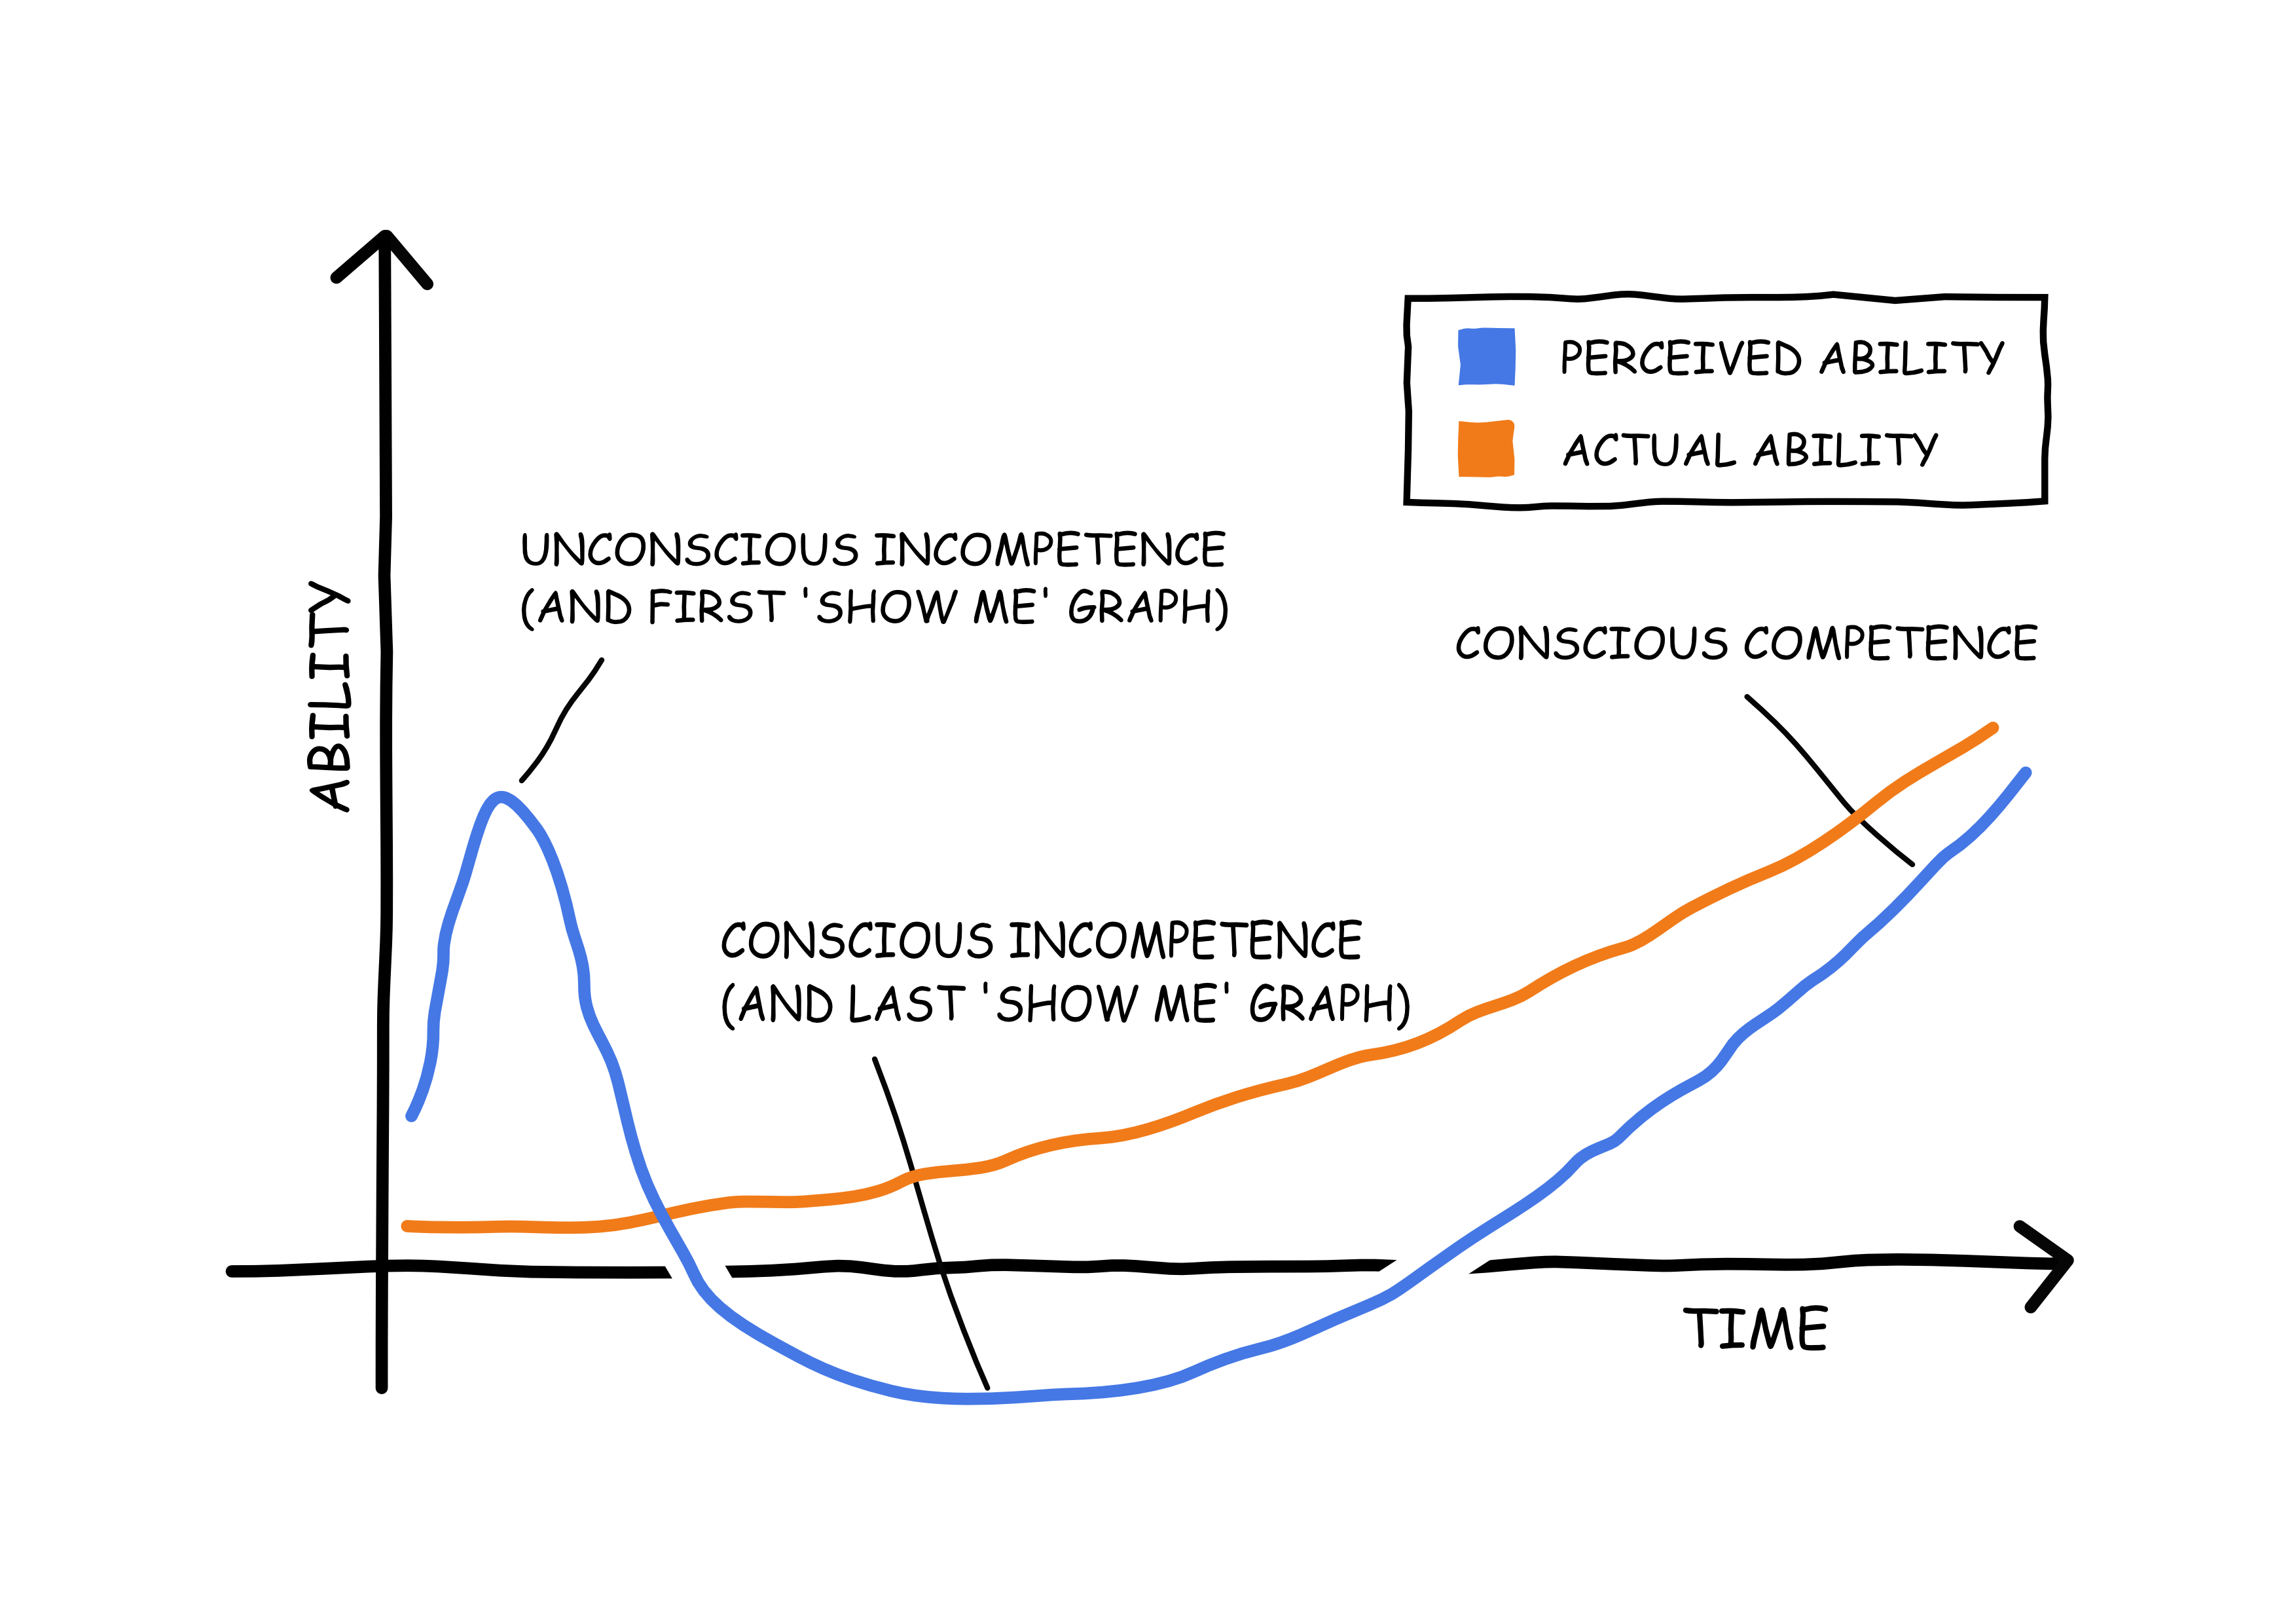
How expectations have clashed with reality regarding my Tableau ability.
Of course, the main software of interest is Tableau and Alteryx that, for the most part, are side-lined for the first week in place of visual best practices, viz makeovers using pen and paper drawings, a debrief on the The Information Lab (TIL) and various talks about Tableau. We’ve had Tableau talk from a sales perspective (Dan Raines), Tableau from a Zen Master’s perspective (Rob Radburn), Tableau from a Senior Vice President of Tableau’s perspective (James Eiloart) and Tableau from a more technical perspective (Jonathan MacDonald).
As far as data visualisation is concerned, I have paraphrased & summarised the salient points:
Keep a log of what you do and why when building a viz. Tracking your decisions may be useful for yourself and clients when justifying what you’ve done. This includes things like filters, scales, grouping, aggregation level and colour choices. Think you’ll remember? You won’t.
Establish the intent of the viz before starting. What’s the specification (if any) in terms of exploratory (user defined message) vs explanatory (creator defined message) and precise (numerical) vs conceptual (abstract).
Minimise thinking and maximise intent. If the user spends more than x (where x is some very small number) seconds working out what the hell it all means, you’ve made it too complicated. Focus on simplicity to tell the story you want to tell.
Perfection is the enemy of the good. If you subscribe to the humblebrag label of ‘perfectionist’ as I do, then you can spend an unconscionable amount of time on something that’s good enough already. If you do have the time, remember that your viz is complete not when you have nothing left to add, but nothing left to takeaway.
And the last thing I’d add is: Ask for help! TIL has an army of Tableau and Alteryx experts waiting to answer your question on how to convert KML files to polygon data. This is probably the most commonly dispensed advice at TIL and I can’t wait to be one of the experts to help others as I embark on my journey at The Data School.