Tableau offers different ways to merge your data. Learn the differences between them to choose when to blend or to join your datasets

Sometimes you would like to use more than one dataset at the same time to create your dashboard. Tableau allows you to merge different data, but it is always great to know which will be the result of each option to make sure you are picking the best one.
In this post I will talk about the following merge types (using very good examples which Andy Kriebel showed us in the Data School):
- Joins and
- Blend
The basics of merging data in Tableau
Both options work in these cases you have a common field in all your datasets. In the example I am showing here I am using Superstore data and an Excel file showing the sales quota for some regions.
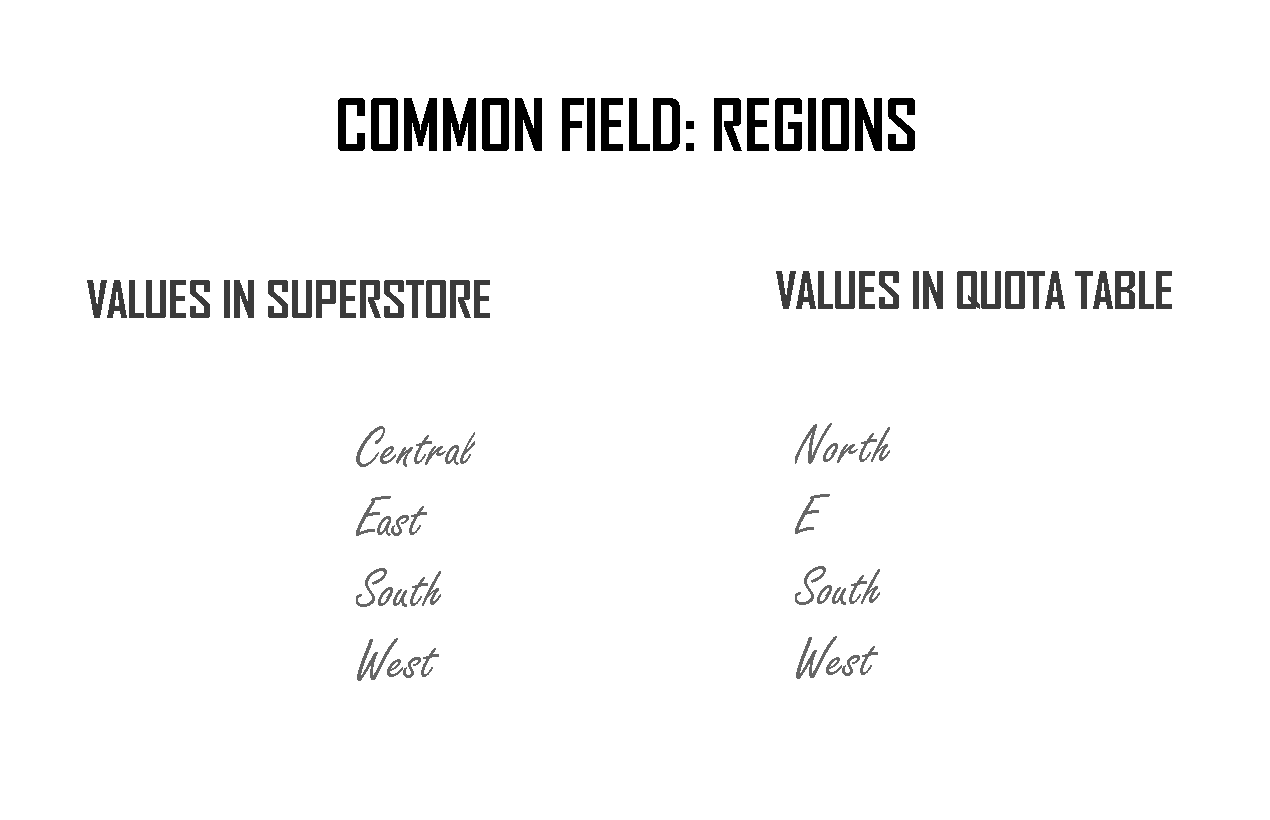
My common fields are the columns showing regions. However, while in Superstore I have Central, East, South and West, in my xls file I have E, West, North and South.
What happens when we perform the different merging types?
Blending in Tableau
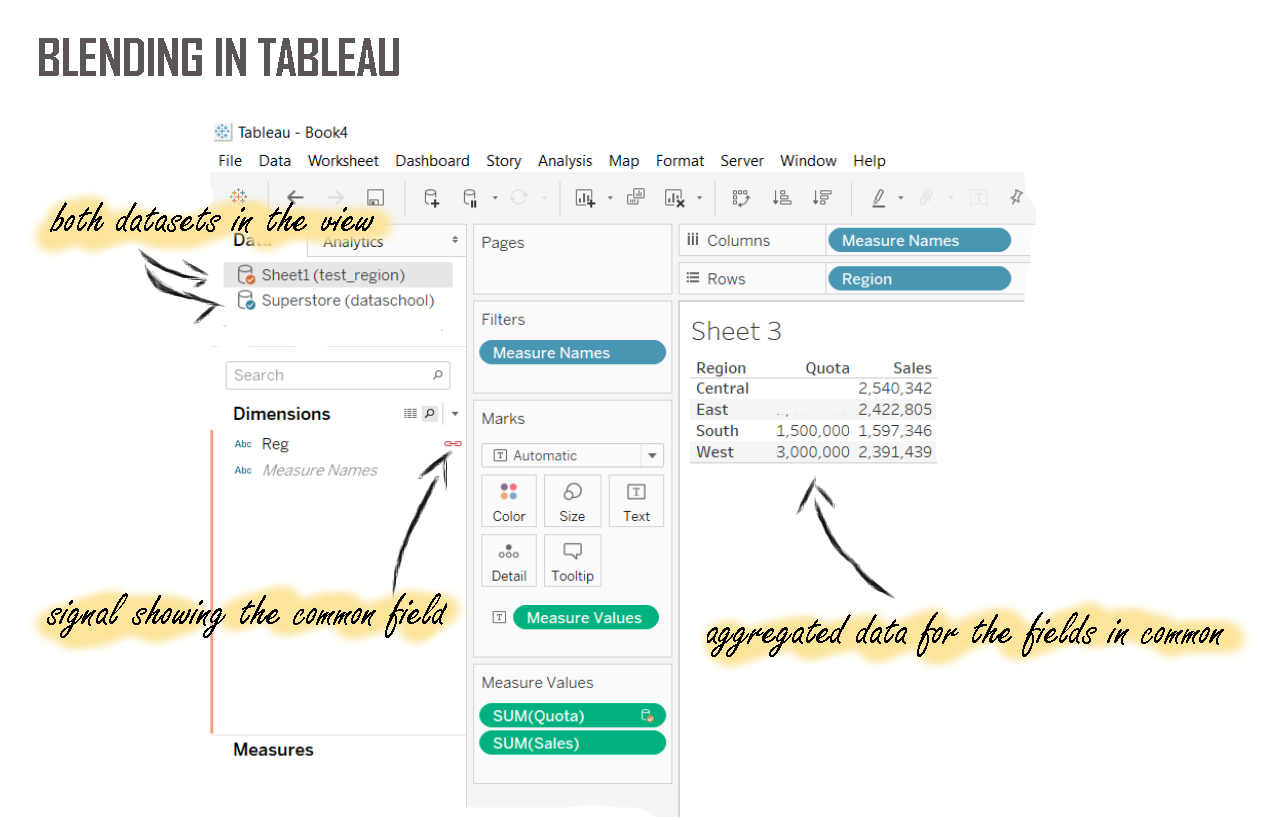
Let’s start blending the two datasets. In this method, Tableau will aggregate the data and execute two different queries each time you ask for the aggregated data.
The primary dataset will be shown in blue and the secondary dataset in orange and the field in common will be marked with a small chain.
When you drag and drop the data to the worksheet, Tableau will keep the rows of the joined field in the primary data source and will aggregate the values for columns in the secondary dataset.
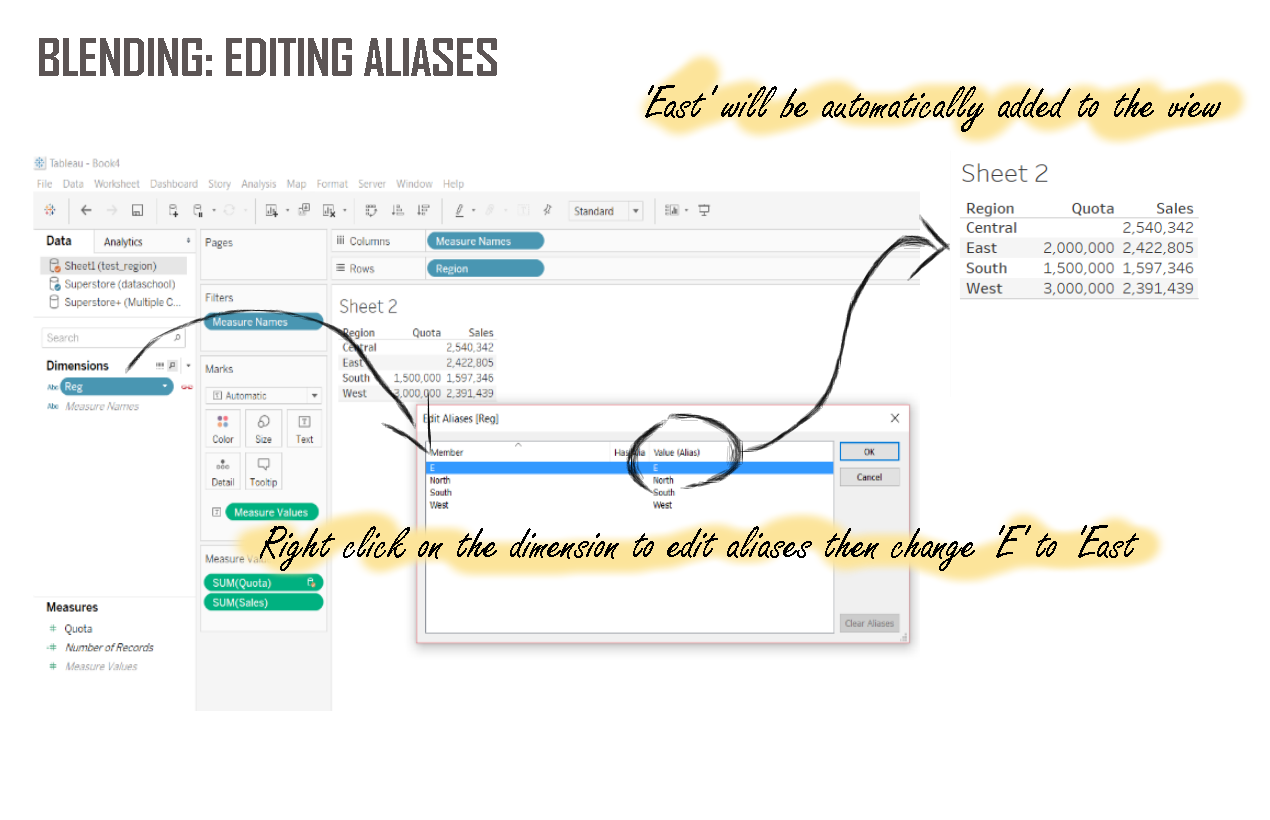
TIP: When blending, you can edit the aliases and Tableau will use this new information immediately. For instance, in this example, if I edit “E” in my quotas table and change it to “East” the quota value for East will be automatically added to the view.
Joining in Tableau
When joining datasets in Tableau instead of keeping two separated datasets and working with multiple queries, the software will generate a joined dataset.
In this case, it will join the data in the row level instead of aggregating it. It can be done in four different ways: as an inner joint, left joint, right joint or full outer joint.
READ MORE: Quick Tips in Pics: Cross-Database Joins
If we think about the quota of sales value we would like to add to the superstore table in this example, it means that each time Tableau finds a row showing “South” it will add a row to the Quota column showing the value of $1,500,000.
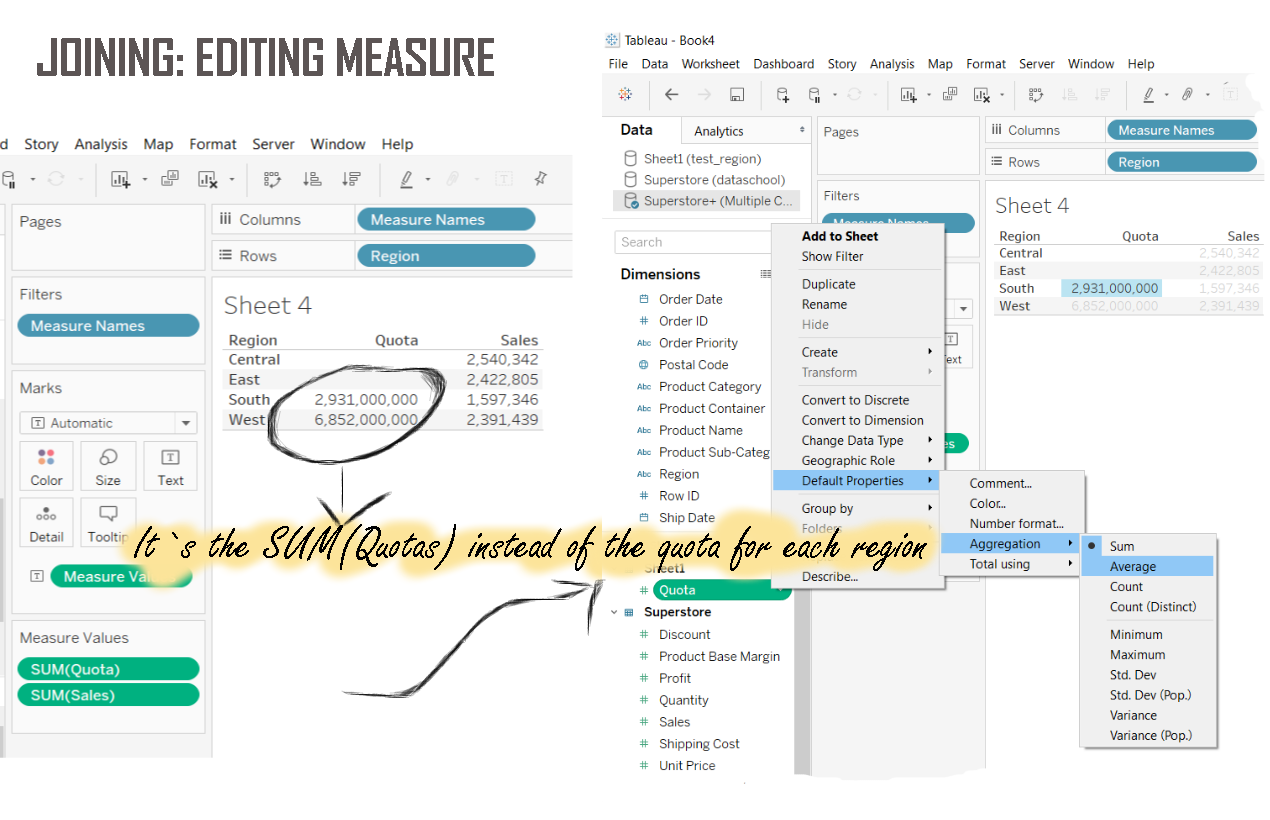
If you drag and drop “Quota” from measures to your view, you will notice that instead of seeing $1,500,000 you will find $2,931,000,000.
It happens because instead of aggregating the value, Tableau is adding up the quota rows (and for each row with ‘South’ we now have a row showing $1,500,000).
To see again the quota value for each region instead of the SUM(Quota) you can edit the measure. Right click on it >> Default Properties >> Aggregate >> Average.
After this, drag and drop the measure again to the view to substitute the previous calculation.
