


Many people are struck and emotionally engaged with the idea of wanderlust – a need or desire to find somewhere new. And for me, and for green, constantly learning and discovering new things is one of the most beautiful and exciting things that anyone can do.
I feel as though this is where and why I am so enchanted with the idea of using data and visualising a story in a way which anyone anywhere can see, understand and interact in order to explore, investigate and ultimately learn what I have learnt from the exercise of putting things together.
The map analogy is perfect – stuff I pick up and learn, I realistically don’t *need* to know; it doesn’t enrich my life or mean that I’m better off in terms of happiness or financial gain from knowing these things – but it gives me a greater level of context, and even encourages me to develop an idea or a question that I want to discover.
This is the cycle of exploring and sharing – it’s just so neat and this perspective, for me; is perfect.
So my Tableau tip? Get some data. Play with the data in Tableau Public. Publish it, and watch your work fly.
Tableau Public takes the excuse of ‘not being able to create visualisations’ away from the world – The simplistic nature, the speed of which you can just download and install is so straightforward.
So straightforward, I can give it to you in a few key steps.
Step 1:
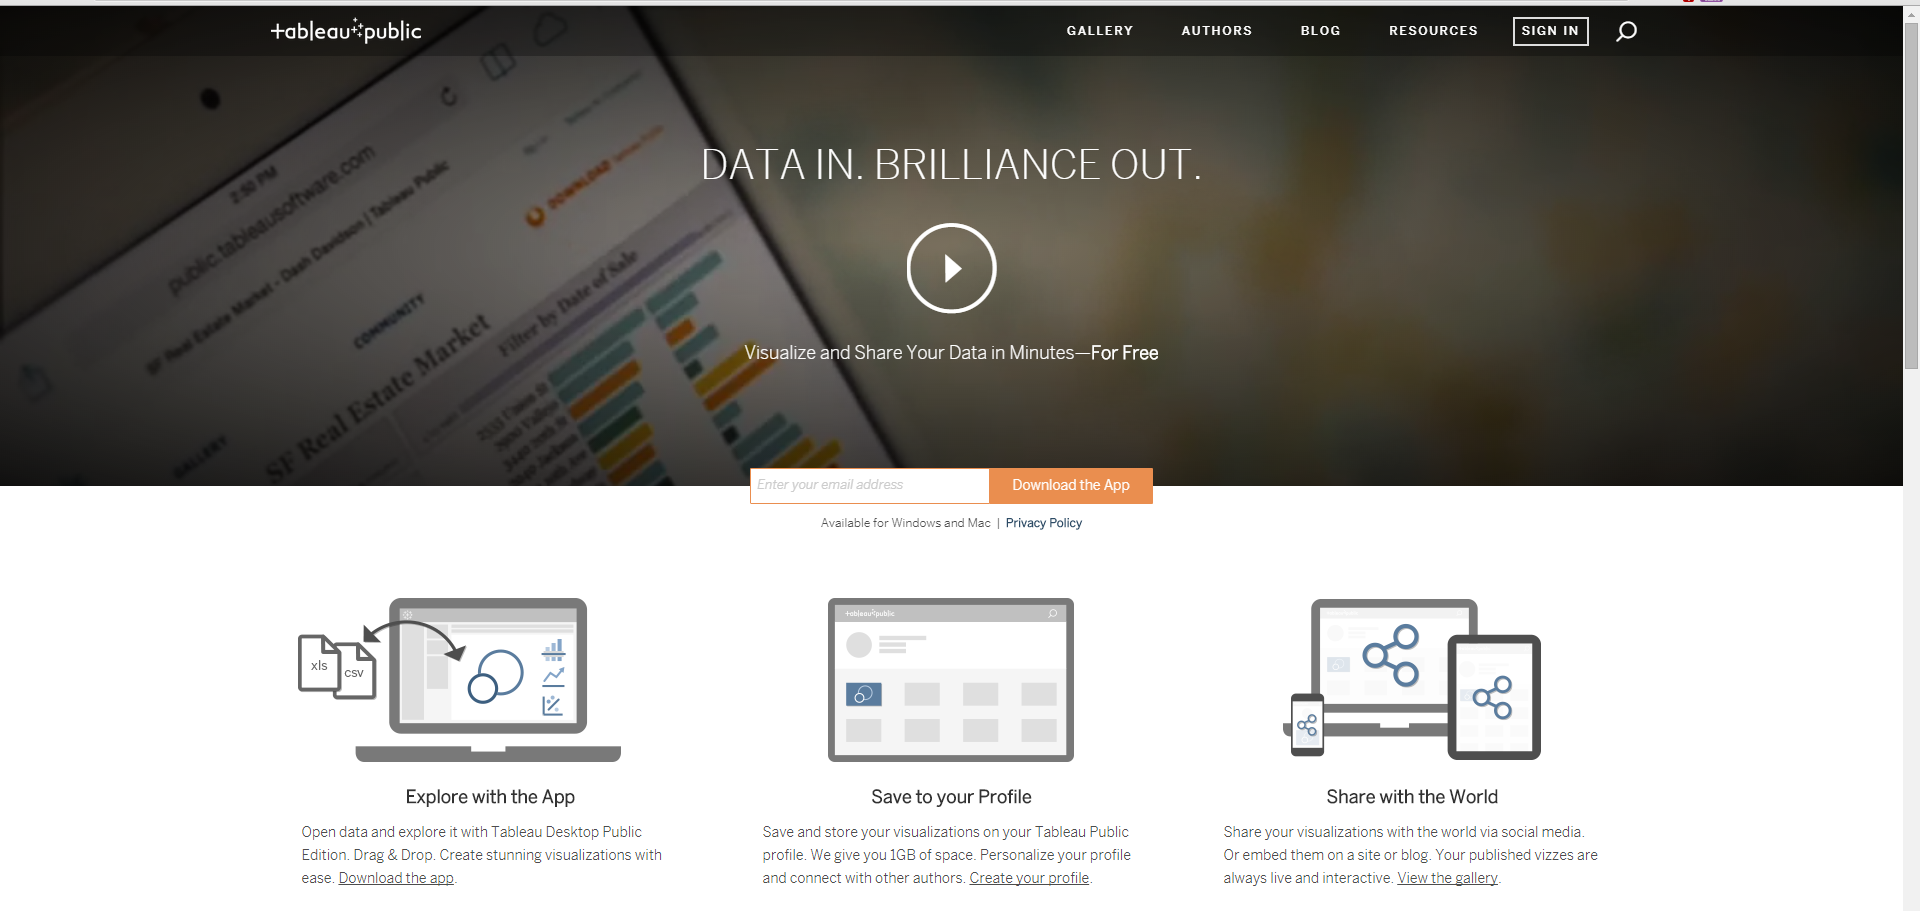
Go on https://public.tableau.com/s/ (or click the image above) and enter your e-mail address, and you’ll be taken here.
2. Install the file
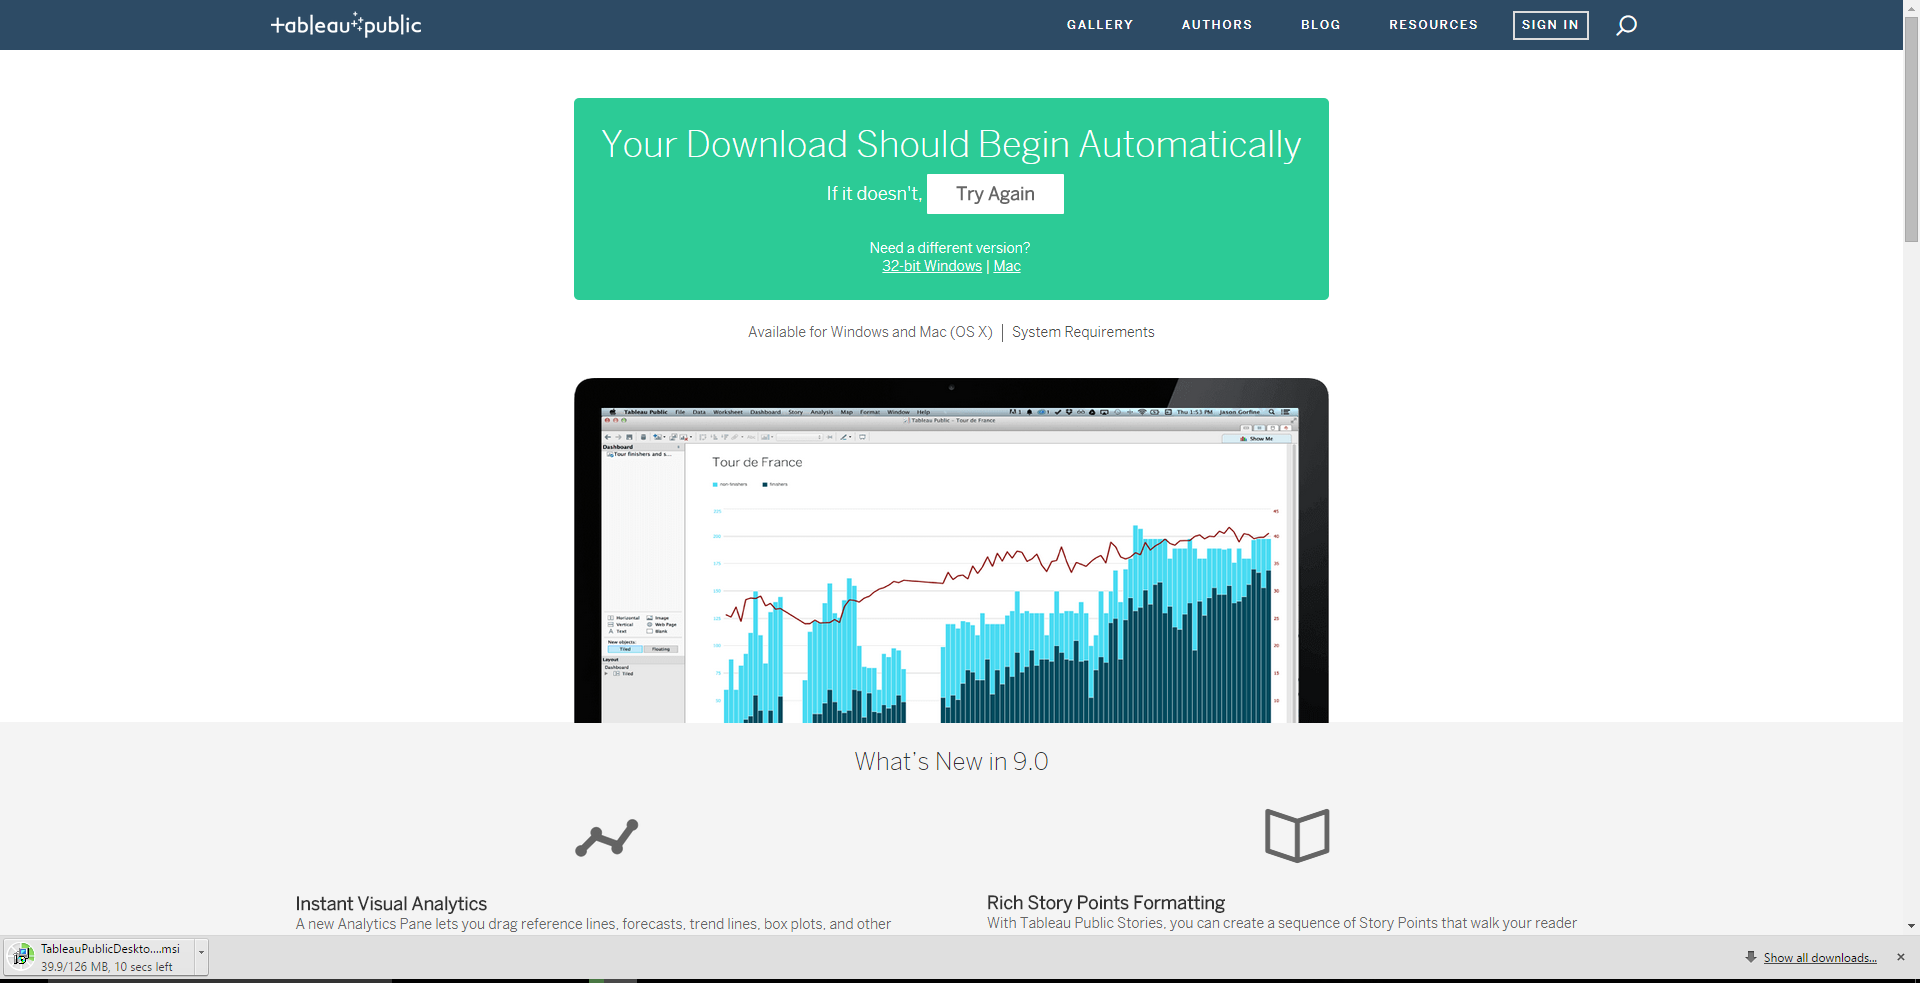
3. Install. Accept T&C’s.
Done? Tableau Public should automatically open, and ta-da! You’re ready to start your data discovery journey.
It really is *that* simple – The entire process took me 3 minutes and 38 seconds. It probably would have been quicker had I not been screenshotting and blogging along the way.
Now what?
– Check out the Viz of the Day (either from the right hand pane of Tableau Public, or through this link), with all the other dashboards which are downloadable – This serves two purposes; One, you can look at examples of what you can create with Tableau Public and two, that you can download these workbooks, open them in Tableau Public and try to understand how they were created. A great way to practise your vizzing skills.
– Connect to Excel, Access or a Text File, and watch how the Tableau magic unfolds as it sorts your data, leaving you just a few clicks away from an array of visualisations.
The best thing to do? Get stuck in. Find a datasource, find an angle, or more importantly find a question that you want to discover the answer to. Start your data journey today, explore your curiosity and feel empowered with Tableau Public.
It’s the best way to get started and ask questions.