My first experience with Tableau was using publically football data, which I had compiled into a spreadsheet for the 14-15 season, on Tableau Public. Of course, Neil Charles’ post was a good base level introduction to Tableau, but it definitely still took me a while to understand measures and dimensions, but the fact you can just start building was awesome.
Since starting at the Information Lab, I have really become an evangelist of Tableau and to an extent, with Alteryx – But when I was applying for job last during my final year at university, I applied to a business intelligence partner who used a program called QlikView. At this point, I hadn’t heard of Tableau or any other business intelligence software.
So this week, I’ve gone rogue.
I downloaded QlikSense (Qlik’s new version of data visualisation software, aimed to move away from the ‘coding’ heavy program of QlikView toward a more visually intuitive platform) and for ‘control’ purposes, I want to recreate one of the first visualisations that I created on my Tableau Public profile, using a dataset which I had compiled myself showing the publically available on the ball actions in the Sky Bet Championship in the 2014/15 season. This would then allow me to gauge the differences and similarities between the two programs.
This first post will look at aethetics and how quickly I could understand how to open and use Tableau vs. QlikSense.
Opening up Tableau
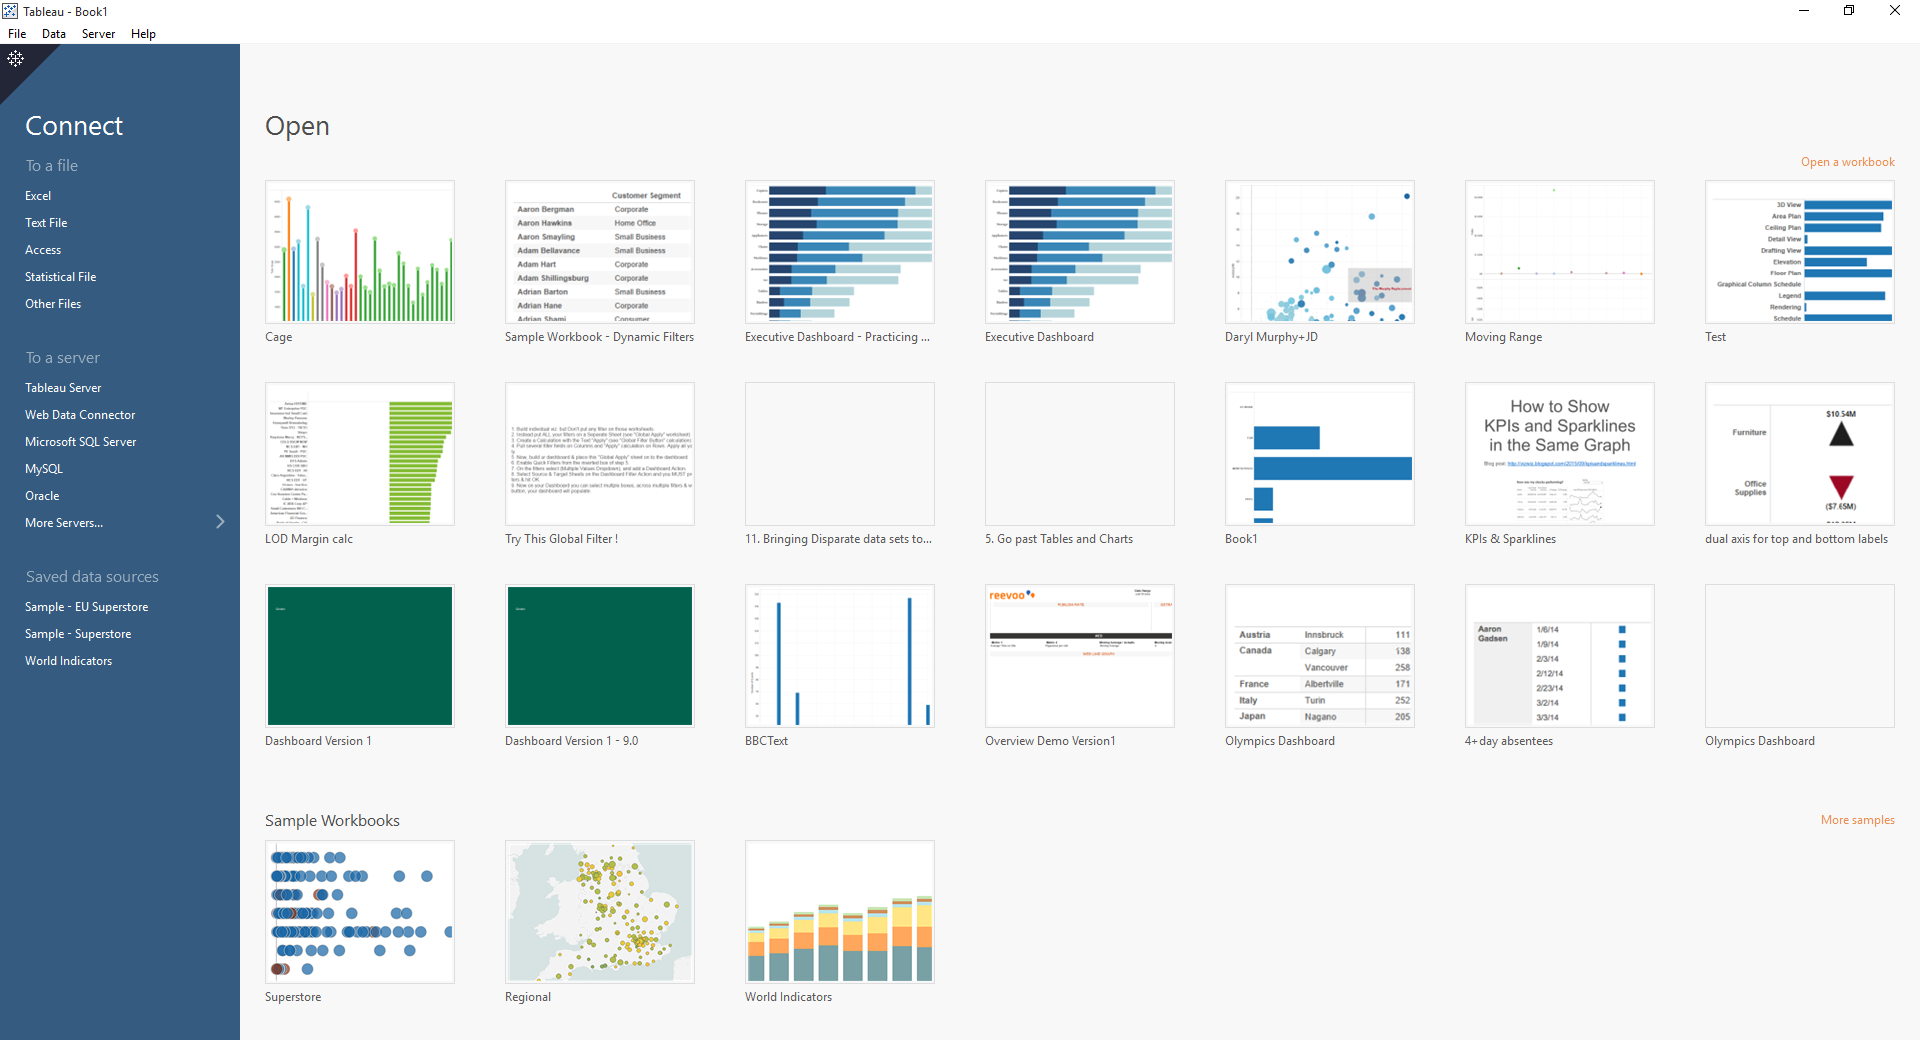
When I open up Tableau, I am greeted with this window.
This is very familiar to me now (after heavily using Tableau for the last 12 weeks); I’m on a train as I write this post, so the right hand pane which usually shows ‘Getting Started’ video links, Viz of the Week and other examples of both work and training is missing – Tableau has detected I’m not connected to the internet so has probably hidden this.
On the left you can see the myriad of data sources I can connected to; to files, to servers and new to 9.1 is I can also connect to Web Data. And finally, there are three sample datasources. Now, I must admit, I was woefully unaware of this when I applied – Probably because all Tableau Public allows you to do is connect to Excel files, Text files and Access databases, as well as OData servers, but any and all inspiration from Tableau Public still downloadable.
The middle, largest section shows firstly my recently opened/used workbooks and below that sample workbooks to help me understand and best use Tableau.
The file I want to connect to is an Excel file, so I can click ‘Excel’ and I’ll get this dialog box.
Super familiar browse of the Windows Explorer directory, familiar to any computer user and I was able to get to my Dropbox, click on my file and….
I think I need Sheet 1, so I’ll drag that in.
Oooh! Very interesting – It took almost over 30 seconds to connect to my sheet, loading the data source for the first time apparently takes a while – But I took this screenshot and hey, presto – this popped up.
A data preview and an instruction to go to my sheet
Nice – So I now have my data loaded, my dimensions and measures are automatically sorted and I am ready to start playing with my data!
Opening up Qlik
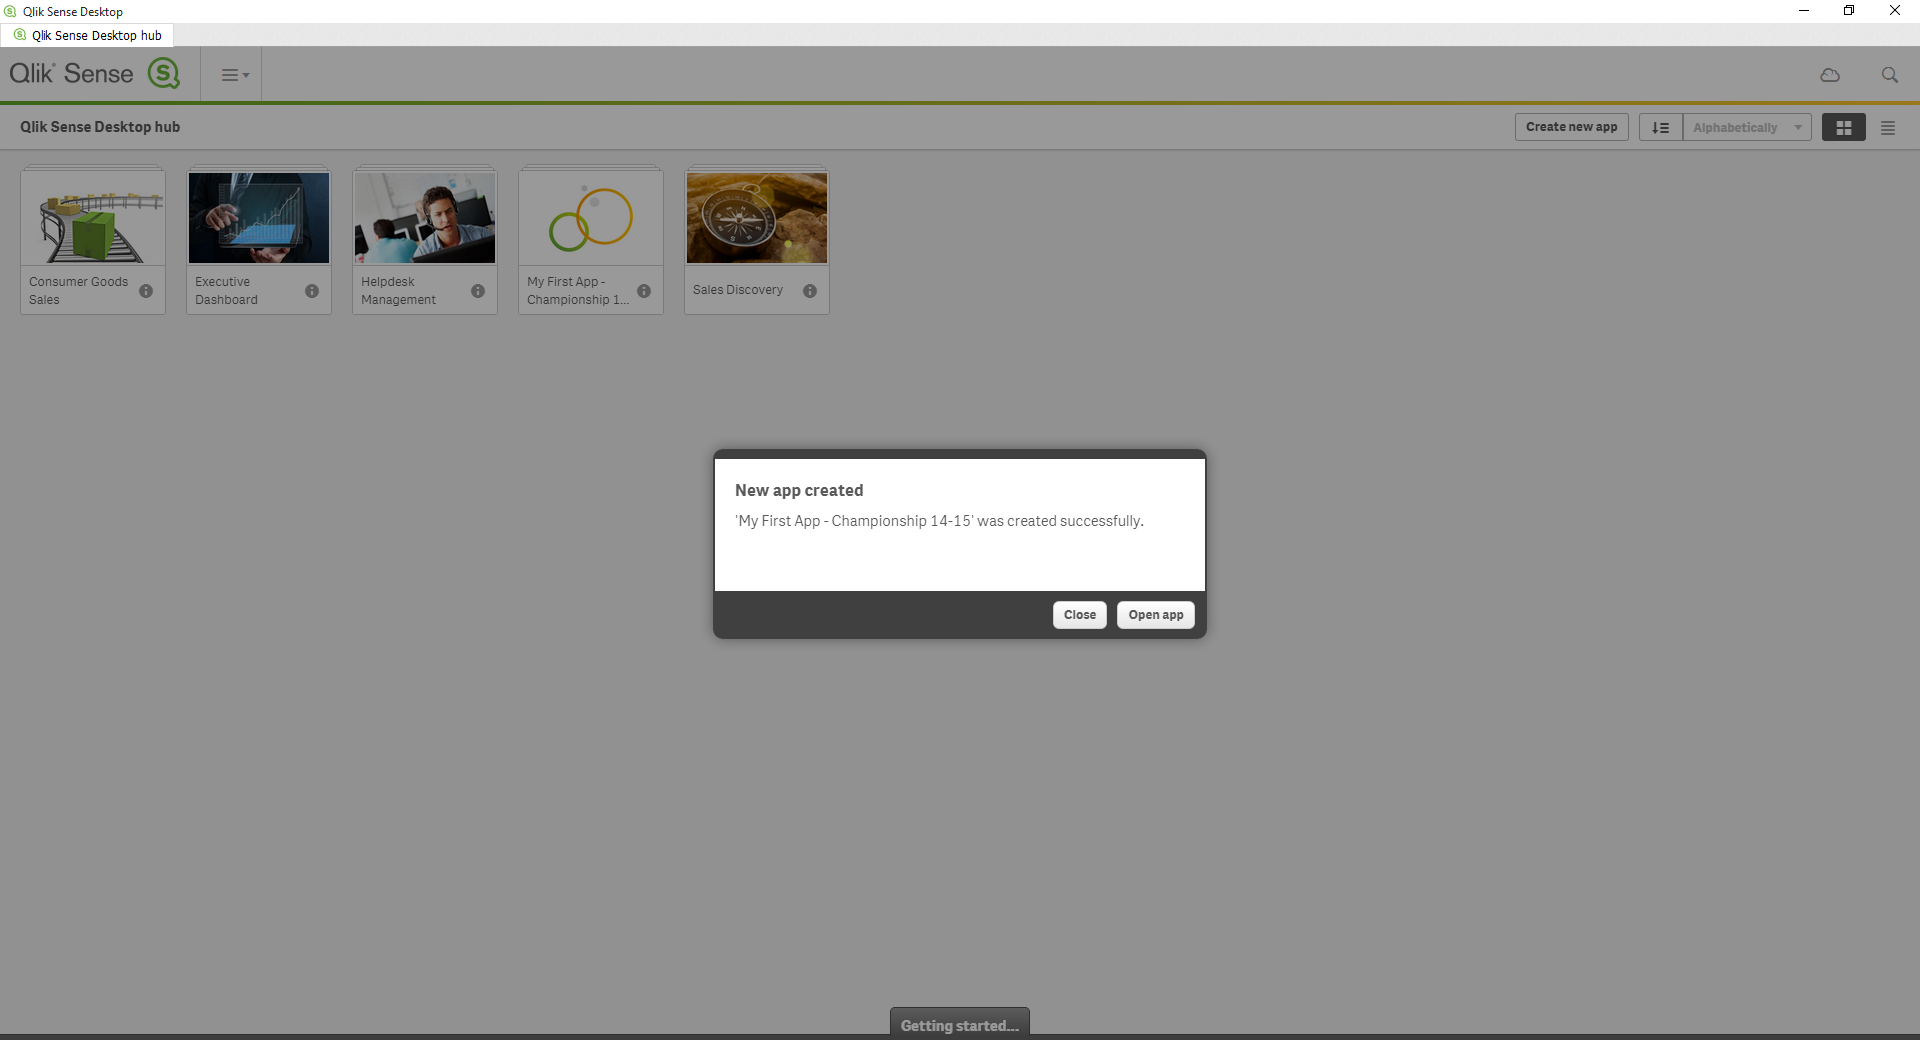
When I open up QlikSense, I get this window
It’s got a very modern app-y feel about it, than Tableau’s kinda classic (?) “this is a Windows program” feel. It immediately prompts me to create a new app – I assume this is basically a workbook, but we’ll get back to that.
Ignoring this dialog box (which I can now disable by un-checking the box) I can see four example ‘apps’ with pretty thumbnails; I don’t immediately have an idea of which are the main datasources that I can connect to through Qlik, but I can probably find this out shortly by clicking (or Qlik-ing..!) around. There’s also a getting started pane, hidden at the bottom.
So let’s create a new app.
I’m prompted to name it, so I’ll call it “My First App – Championship 14-15”
Woo hoo! I’ve created my first app; I can even see it alphabetically sorted with the other example apps. Neat-o.
So let’s open the app.
Alright, let’s get this party started
So I can add data from a file, a database or from Qlik’s DataMarket (I’ll look into this when I have internet, but if this is a secondary income source – Well played, Qlik.) I’ve been told that QlikView was very code heavy, and allowed more levels of versatility, so it says I can use the Data Load Editor to perform data transformation with data load script.
Sounds ominous and scary. I’ll ignore that, it’s why I’ve been using Alteryx. I think. If that’s the same thing…
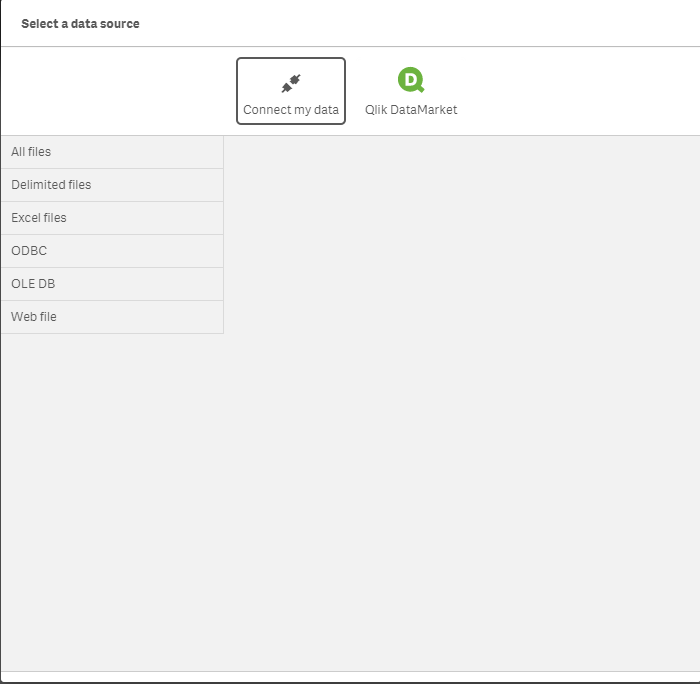
When I add data, I get this screen pop up.
I’m embarrassed to say I don’t know what ODBC or OLE DB mean, apart from the DB parts of both probably means database, and I’d guess the O stands for Open. But this is probably my fault than Qlik’s – I can see that I can connect to a web file, delimited, excel files etc. So a fairly comprehensive list. My vat of data that I spent too long copy and pasting is in Excel format, so this is perfect. But what’s Qlik DataMarket?!
So this is a bit like Quandl, I guess? It has specific data on business, demographics, weather etc. This would be neat for comparisons, maybe even some blending on dimensions like country. Neat; but I can’t connect because again – No internet. One to check back on later.
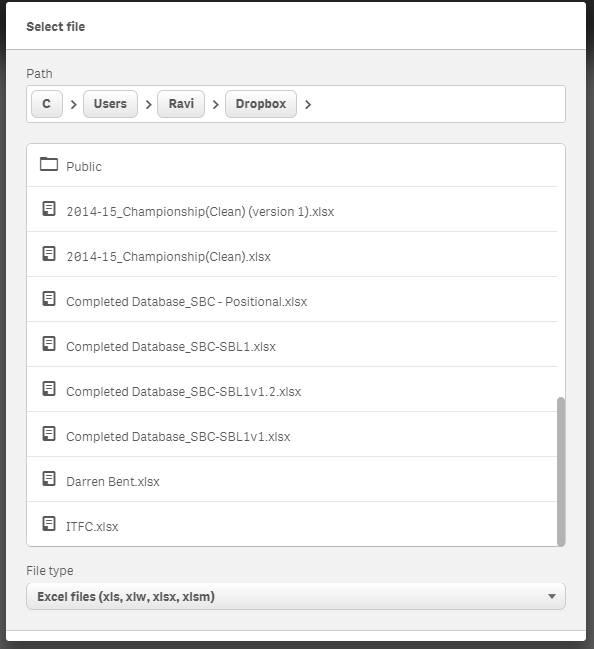
Right – So I have to navigate to my file..? It’s on my Dropbox, so I’m going find how to get there first…
So this interface is a bit unfamiliar, unlike the way you connect in Tableau which is using the interface which is native to Windows, but it’s not awful. Just follows their app theme.
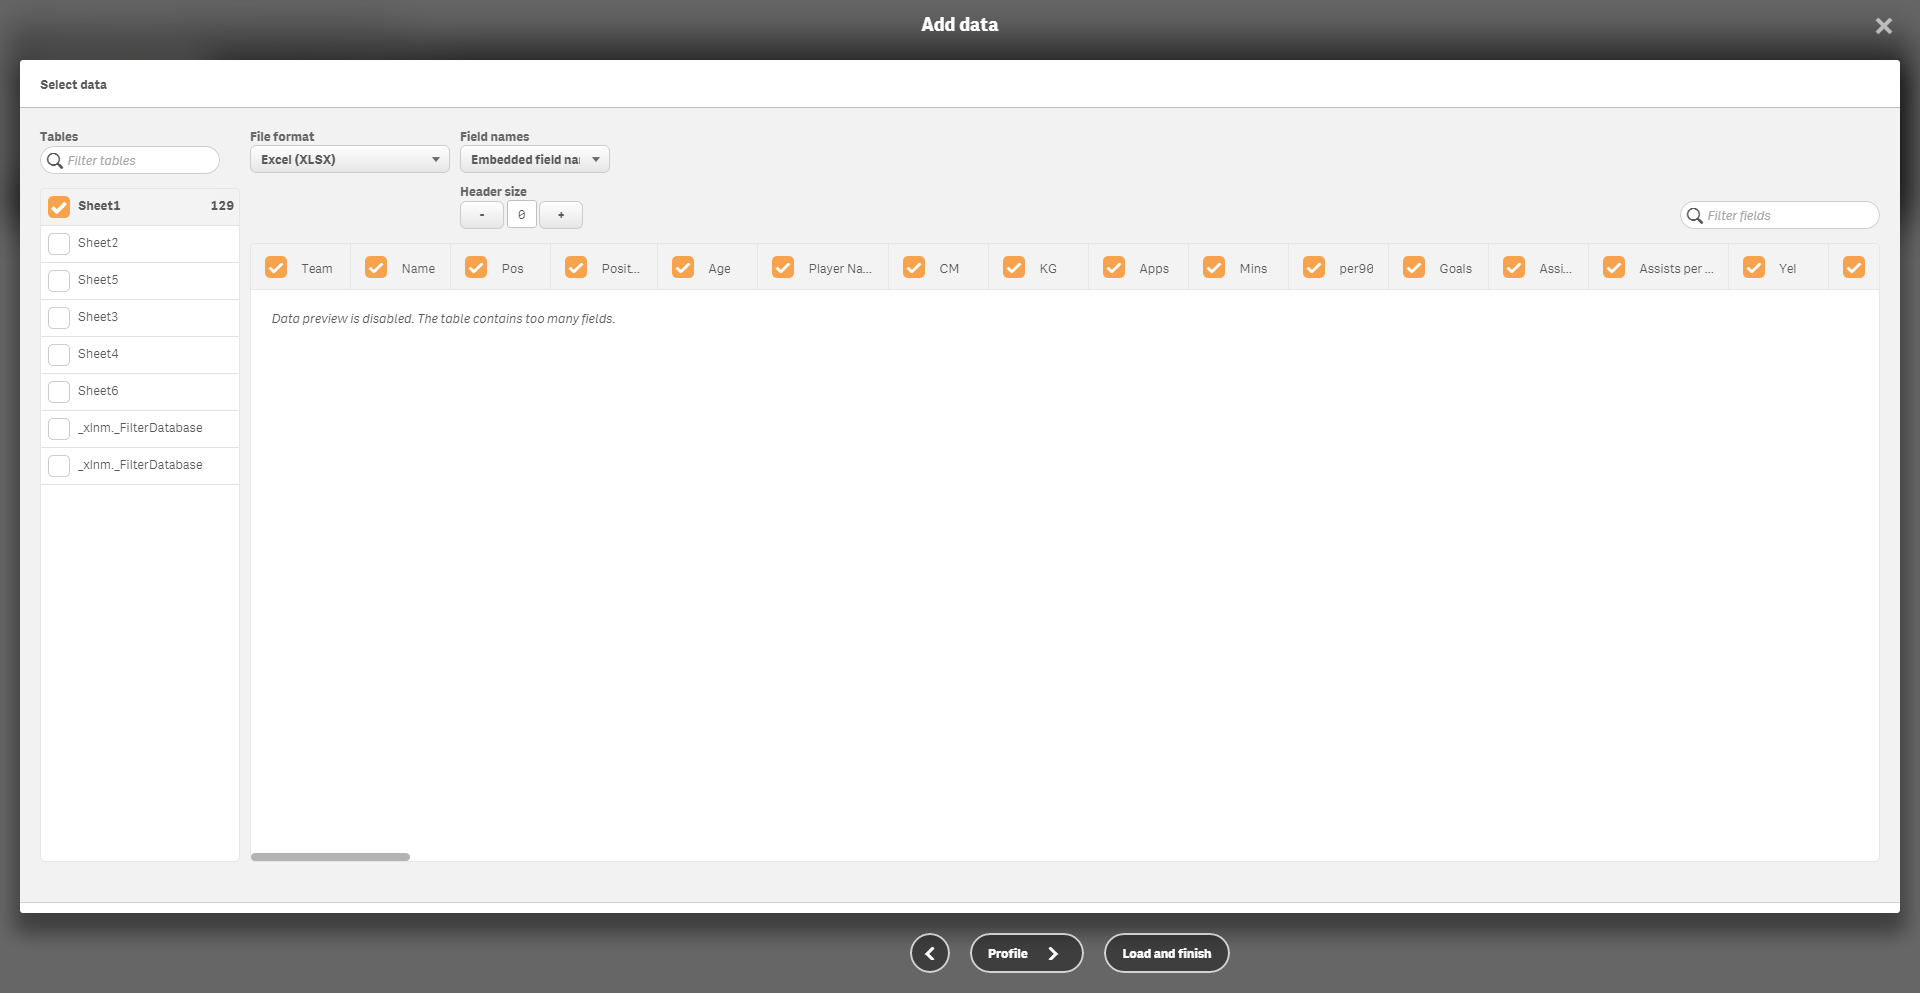
Nice! I can select the sheet, or sheets I want to use, and choose which field names I want to use and also increase the header size (I did this, and stuff happened which I didn’t want to, so I’ve left it at 0 because it looks right). The ‘Filter Tables’ part is a bit useless. I typed in Ipswich and it told me (again) that the data preview is disabled because the table had too many fields. Ha, big data! Though, this could be the reason that Tableau took so long extracting the data – Perhaps Qlik has a built in intelligence which scans the rows and fields and says “Woah! Let’s not get into pulling all this out now”
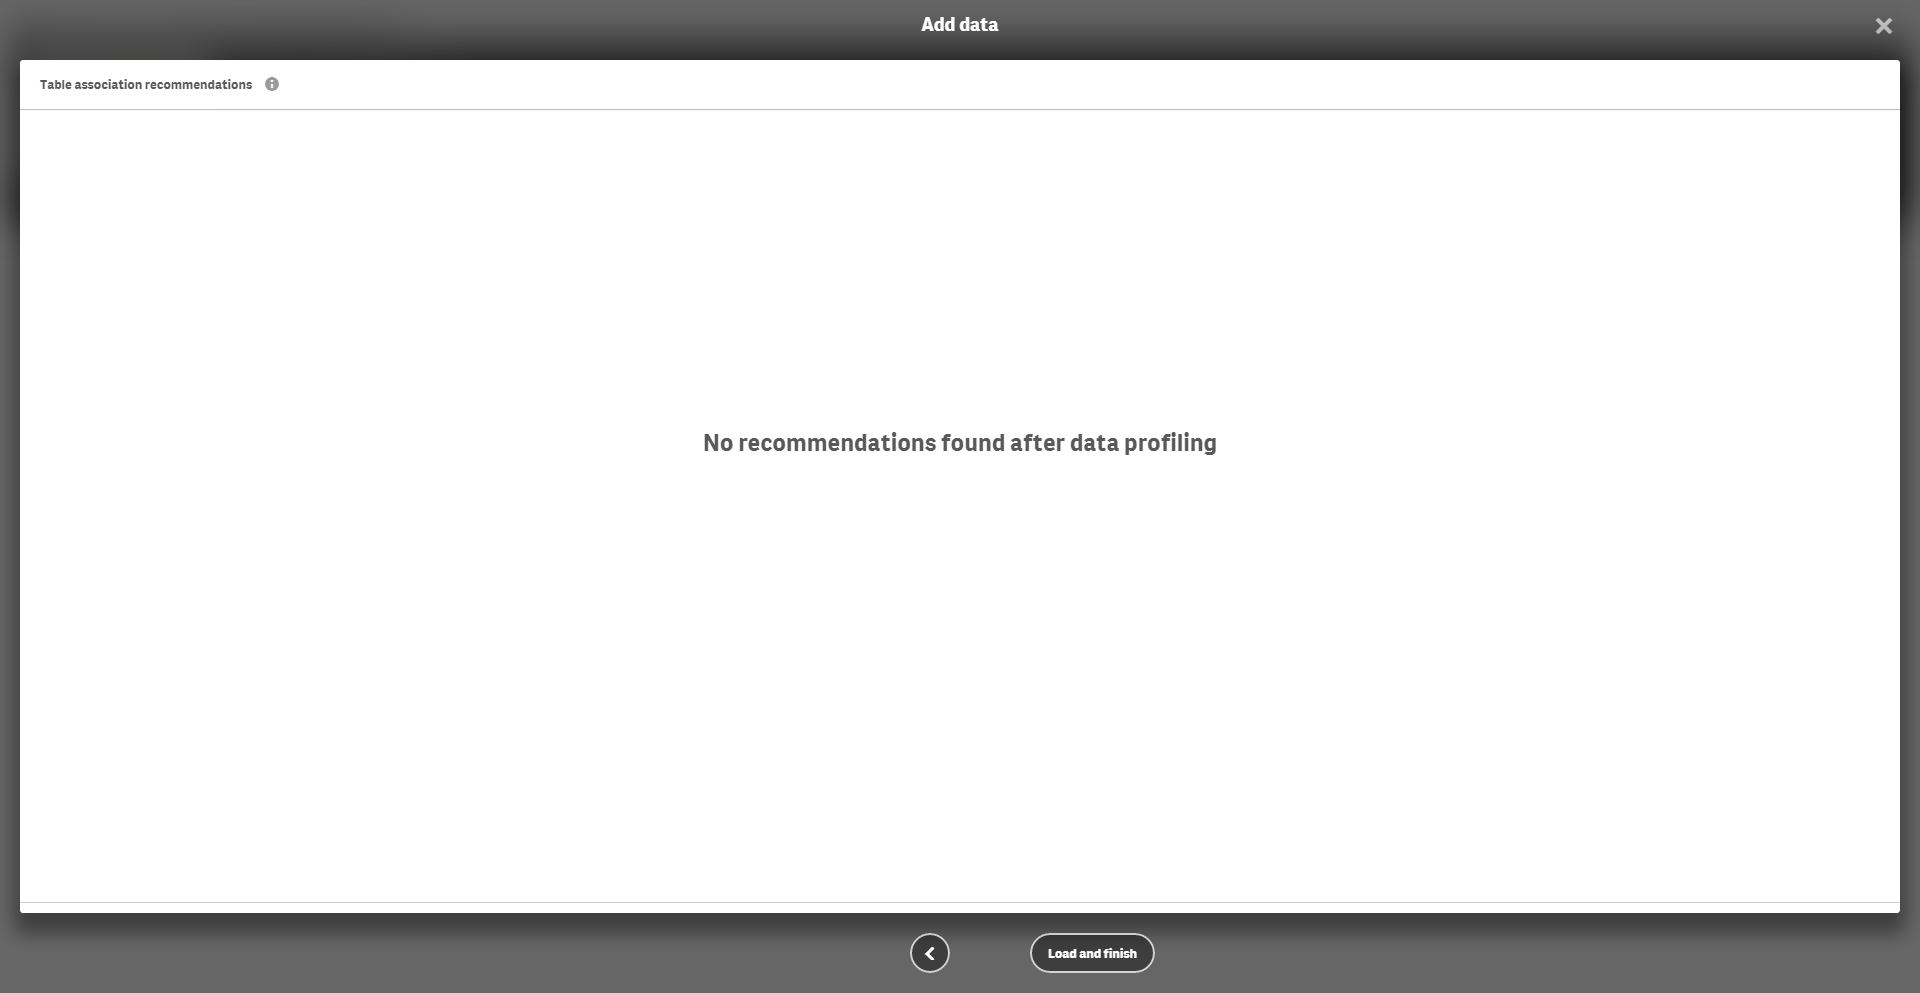
So now I’m ready to – Wait what does profile do? I clicked it, it did something and loaded and gave me this;
I don’t know what it did – I’ll look it up later. Let’s load and finish.
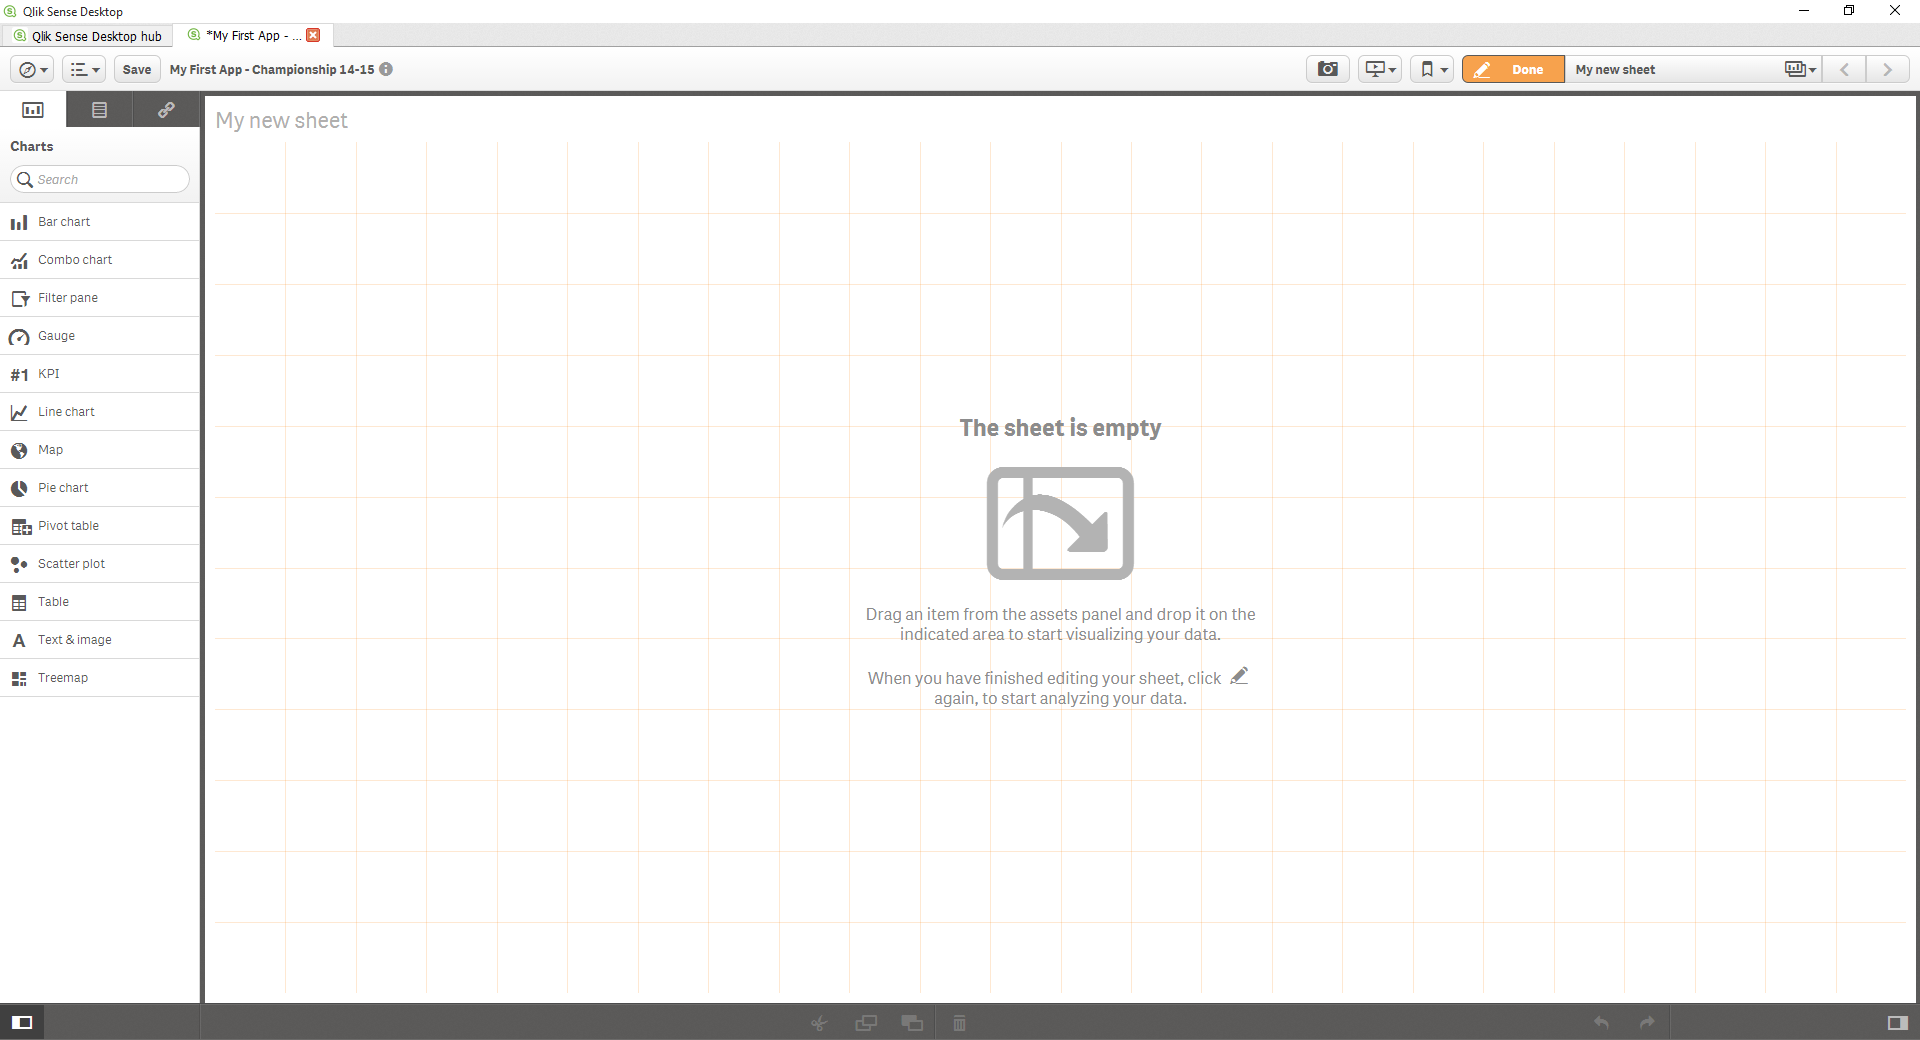
After one second, I’m presented with this!
Ready to start building!
Conclusions
QlikSense has a very “modern program” feel to it, one that has 3D buttons, almost a Flash/Javascript-y feel about it, and guides you every step of the way in separate windows. Tableau on the other hand, allows you to move through the data-connection process in some easy steps. Small cues, simple instruction – It’s almost as though it knows it doesn’t need to hold your hand all the way through.
What I did after writing this whilst screen shotting is time how long it takes each program to do each process – Now I know what to do and how to navigate, let’s see which is quicker to open & connect to my data. To make it fair, I’m restarting my computer so Tableau doesn’t benefit from it’s in-memory storage!
Tableau – 28 seconds
Qlik – 55 seconds
So I restarted and ran the process again in Tableau and it ran much faster; perhaps it was slow connecting to the data because it was already connected to Qlik? I don’t know. I might run this as a test again in a few days when I write part two of this blog post, and see which is faster.
So, in terms of connecting to data; if you would like to be stepped through the process and shown the variety of options and additional value that Qlik has, then Qlik is a good tool for you, and if you have a vague idea of what you’re doing or like the familiarity of the Windows interface, then perhaps it’s easier on Tableau.
It’s a real personal preference thing – I think I’d love to read how Qlik interprets data; at the Data School we’ve talked about how Tableau processes data, how it houses some aspects in memory and the method in which window calculations etc work.
I hope you enjoyed it, Part 2 will likely be next week when I return after my graduation ceremony! In the meantime, any thoughts, feedback or ideas of things to test and/or compare are welcome!
Thanks for reading.

