In todays Tableau time we went over how to calculate a dynamic moving average in Tableau, which is a really useful tool to include in a dashboard to increase interactivity.
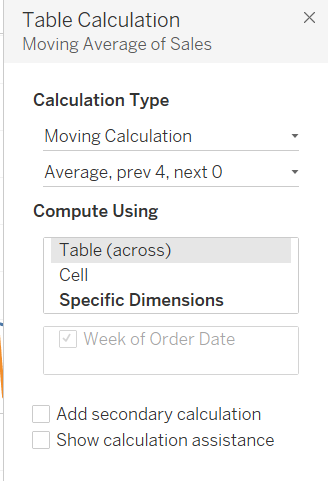
Initially I created a simple line chart using date (continuous weeks) on the columns shelf and sales on the row shelf. I then created a second axis, also adding a quick table calculation on the new sales where I set the calculation to moving average, changing the standard deviation to prev 4 and the summarize to average. This is because we want to be looking at the average of the current point and the previous 4 to get the moving average.
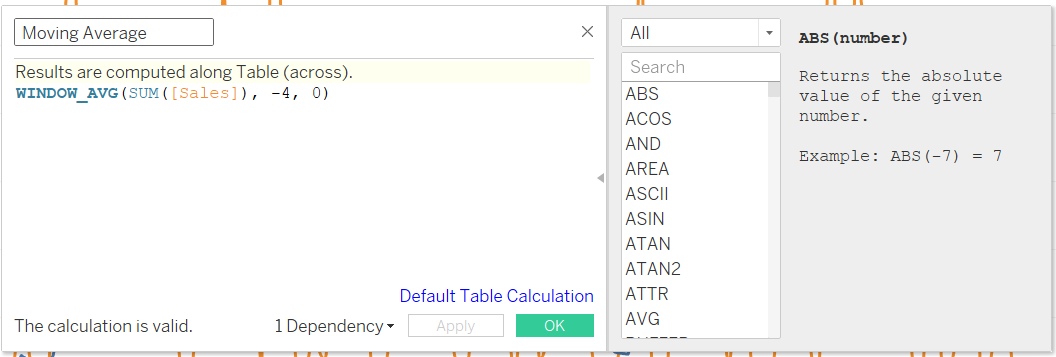
Once I had created this quick table calculation I dragged the new sales pill onto the data pane where we can see the formula that was used in the quick table calculation.
In order to create interactivity and allow the user to change the number of weeks in the moving average, we need to create a parameter. I created a parameter with an integer value so it can be used in the calculated field later. By creating a parameter we can then edit the calculated field above to include the parameter so the average can be changed.
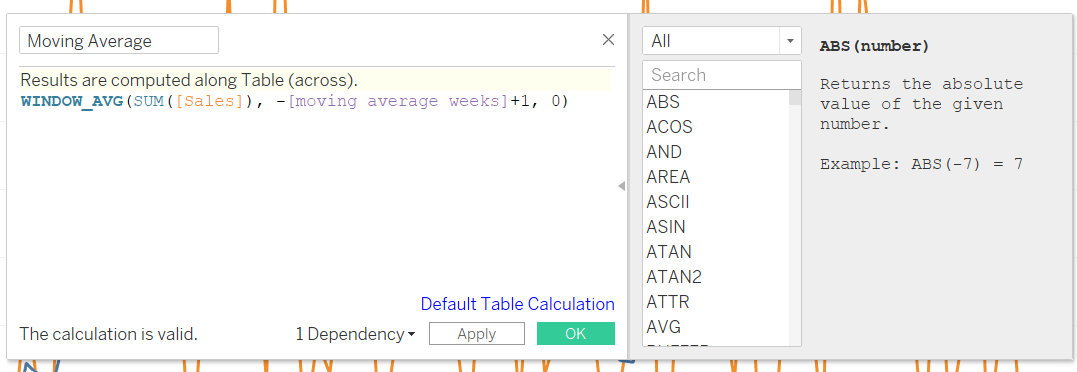
By adding in the parameter and replacing the -4 with +1 as we are including the current value in the parameter. All we need to do is show the parameter on the worksheet and edit the number of weeks the parameter takes into account.
The full run through can be seen in the clip below: