


For our first day of Dashboard week our challenge was to use the API provided to access UK crime data. Build an Alteryx App that allows the user to pick a date range and category and enter a postcode. The app needed to automatically update our dashboards on Tableau Public.
I will outline the steps I took to complete this task below.
The initial API provided in the task provided data on the crimes and had a specific latitude and longitude, year and month. In order to meet the brief we needed information regarding postcodes. Therefore, I also used a Mapbox API in order to find the latitude and longitude for each postcode.
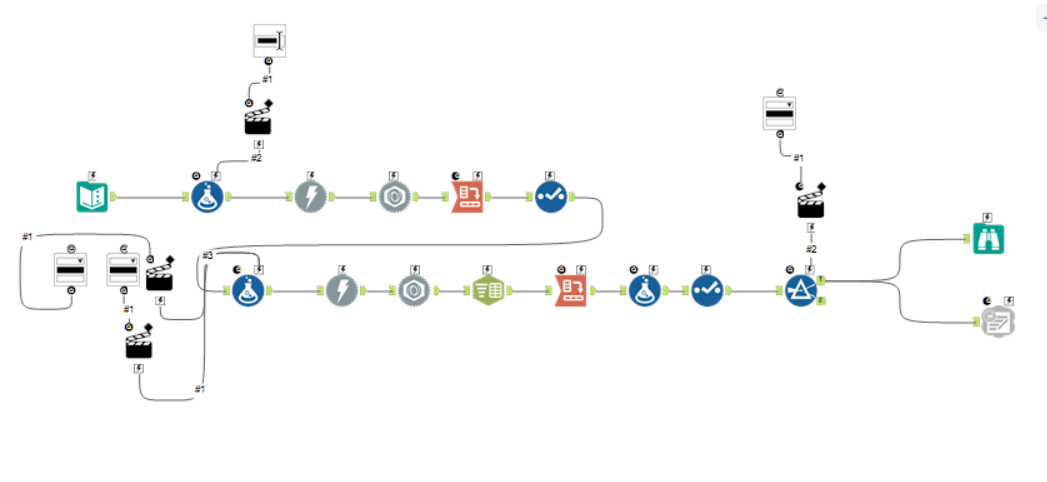
The start of the workflow focuses on being able to enter a postcode and receive the latitude and longitude. URL for the Mapbox API was:
https://api.mapbox.com/geocoding/v5/mapbox.places/(Entered postcode replace here).json?access_token=pk.eyJ1Ijoiam9lbC1ha2FqZS1tYWNhdWxleSIsImEiOiJjbDUwcnpxbDAwOGc4M2ptdHRyNzFzeW5lIn0.jK5VSpIGDtF1oQkfVHRv5w
The URL can be thought of in 3 distinct sections, the first half, the middle section (the postcode) and the end of the URL. Because we want to be able to change the Postcode through an App I used the Formula tool to break the URL up into the above sections.
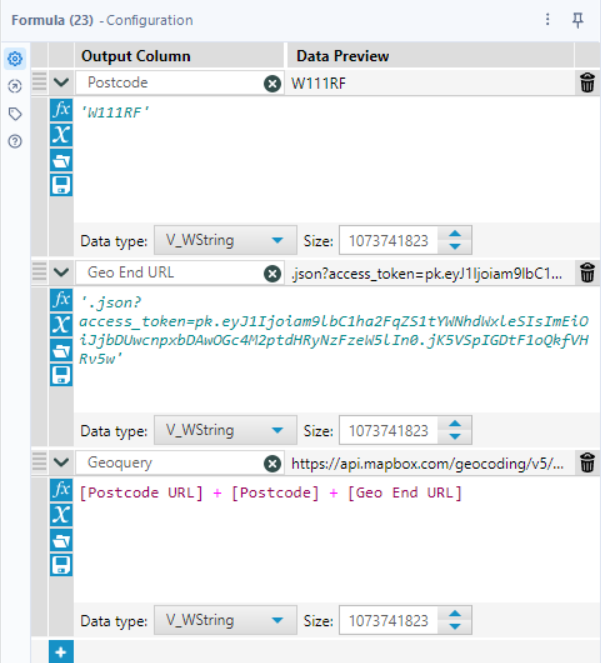
Therefore in the text input only enter the first half of the URL. I then create a column to hold a postcode and then another column for the end of the URL. These are all saves as string fields. Finally I create a final column joining together all the columns I have just made.
I then use a Download tool, JSON Parse and Crosstab to reformat the downloaded data. I finally use a select tool so that only the latitude and longitude are kept. I also used a Dropdown and action tool and connected them to my formula tool. This mean that I could make an App where I could amend the postcode field and this create a different latitude and longitude after the data is downloaded.
The API URL containing the data for crimes looked like this:
https://data.police.uk/api/crimes-street/all-crime?lat=52.629729&lng=-1.131592&date=2017-01
This URL can also be split into a few sections the initial URL, Latitude, Longitude, Year and Month. Like previously I used a formula tool in order to break up the URL which is outlined below.
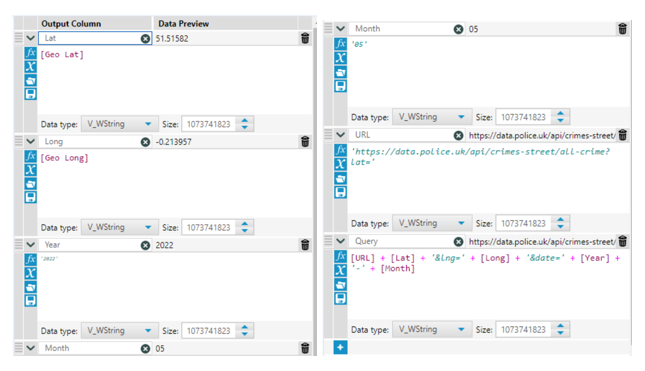
In the second formula tool I used the Longitude and latitude outputs from the previous flow.
I also connected another dropdown and action tool for both month and year so that the two columns could be updated to change the data that is pulled through the API.
I then used I then use a Download tool, JSON Parse, Crosstab, Text to columns to refigure the data. I then used a select and formula tool to reformat some of the data and change the data types.
The brief also included being able to change the Category type. To include this I used a filter tool which I connected the dropdown option tool to, allowing mew to update the category as well.
Finally I connected this to an output tool. in order to make the output updateable on Tableau Public I had to download a Google Sheets extension.
I then created my dashboard and ensured that when I saved the dashboard to Tableau Public that I selected the option to keep the connection with the data source.
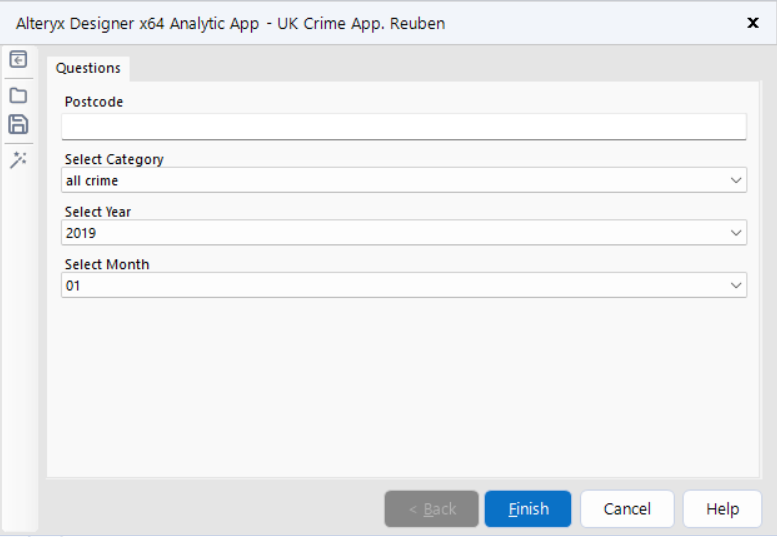
The final App interface pane is shown above and outlines all the fields that we can change in order to update the dashboard view.