It’s day 3 of #TipWeek here at the Data School and today I’m going to show you how to build a route map. This can be used to chart a variety of things such as personal exercise or movement data, collected by apps such as Strava or Moves, or for navigation maps to understand where your goods are going to and from.
For all maps, the main fields required are always latitude and longitude (or X and Y for non-geographic ‘maps’) and a dimension with which to separate your data into each individual activity. However, to move from a simple plotted map to one which follows a specific route, you need an additional field that helps you identify the path that your route is taking.
In this example, I used The Information Lab Web Data Connector to connect to my own Strava running app. This provided me with a latitude and longitude captured every few seconds during my run, an activity ID specific to that particular run and start time/distance for the run. Additionally, every time it captured my location, it appended a path ID to tell me in which geographical order I ran.

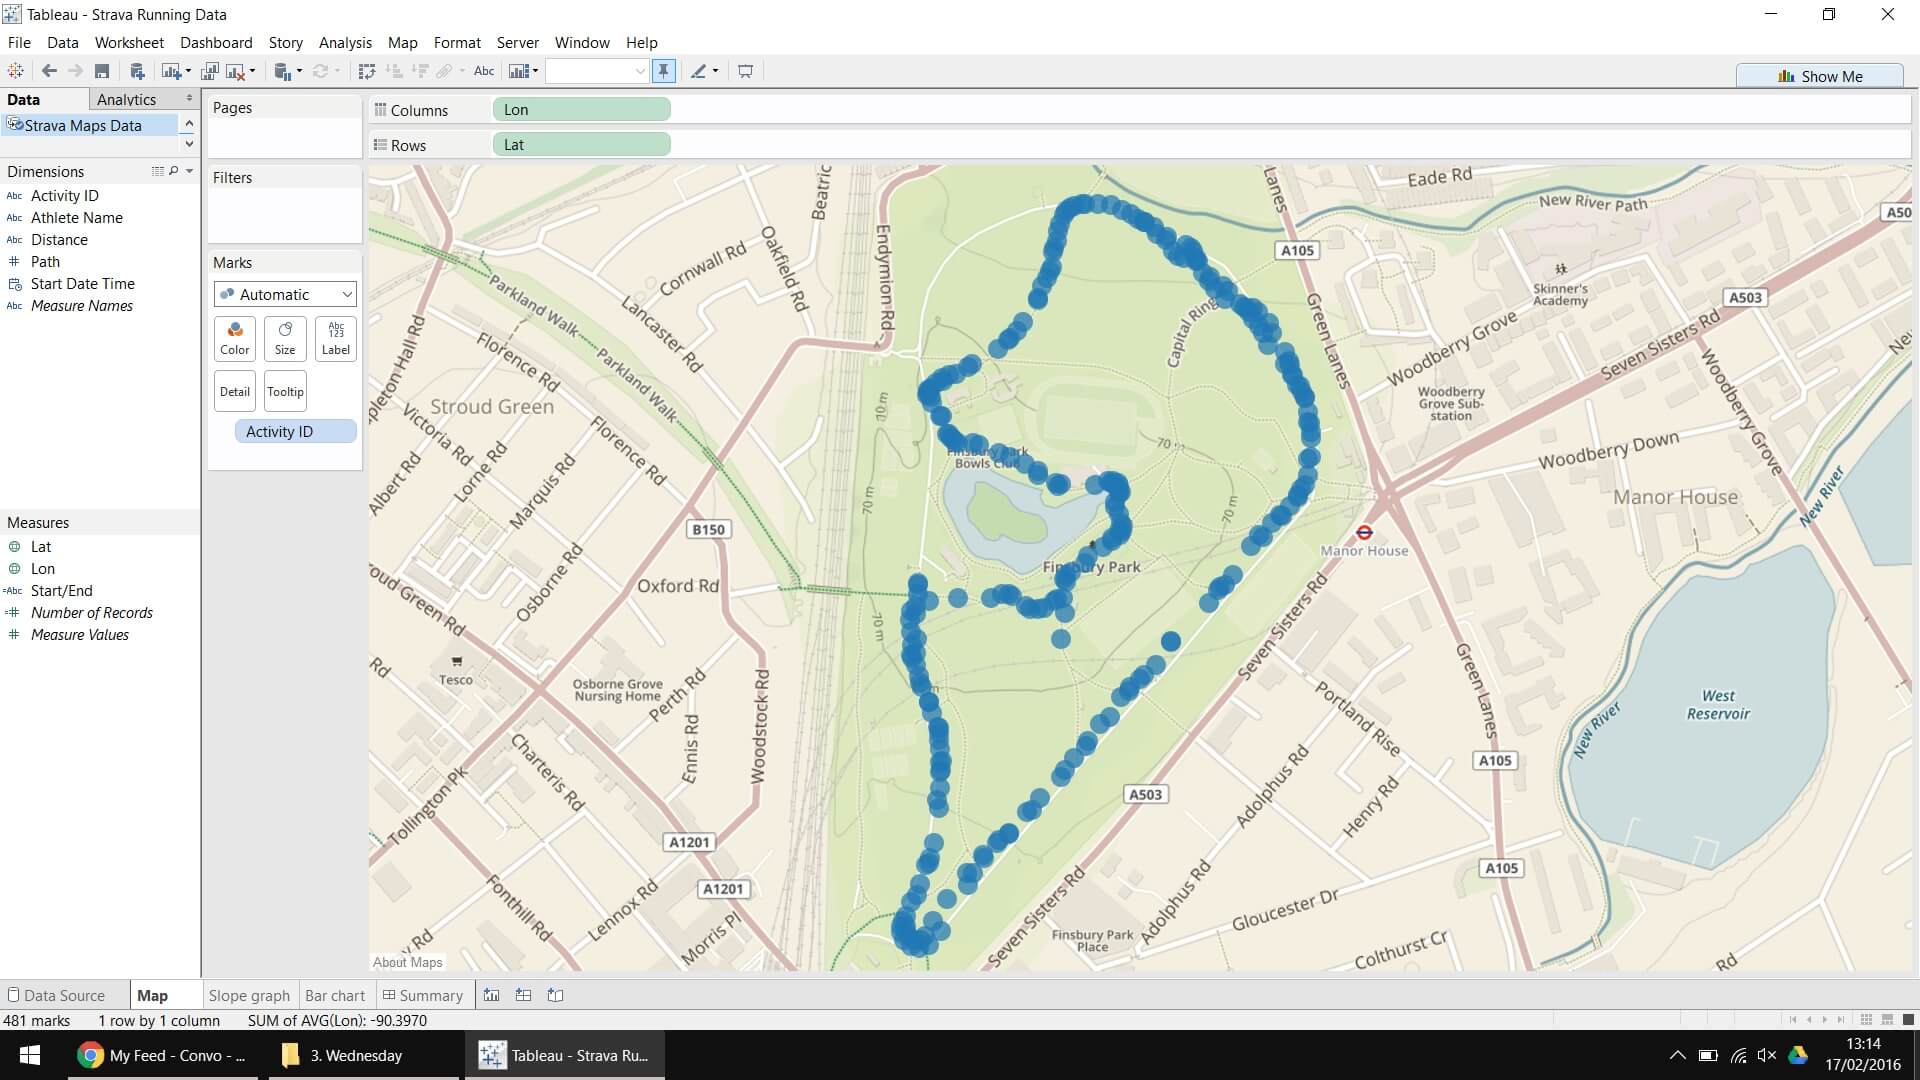
Now to create the map, drag Lat to rows, Long to columns and Activity ID onto the detail shelf. At this point, Tableau will effectively draw a scatterplot using the Lat and Long measures on top of a map image showing all the different points Strava recorded I was at.

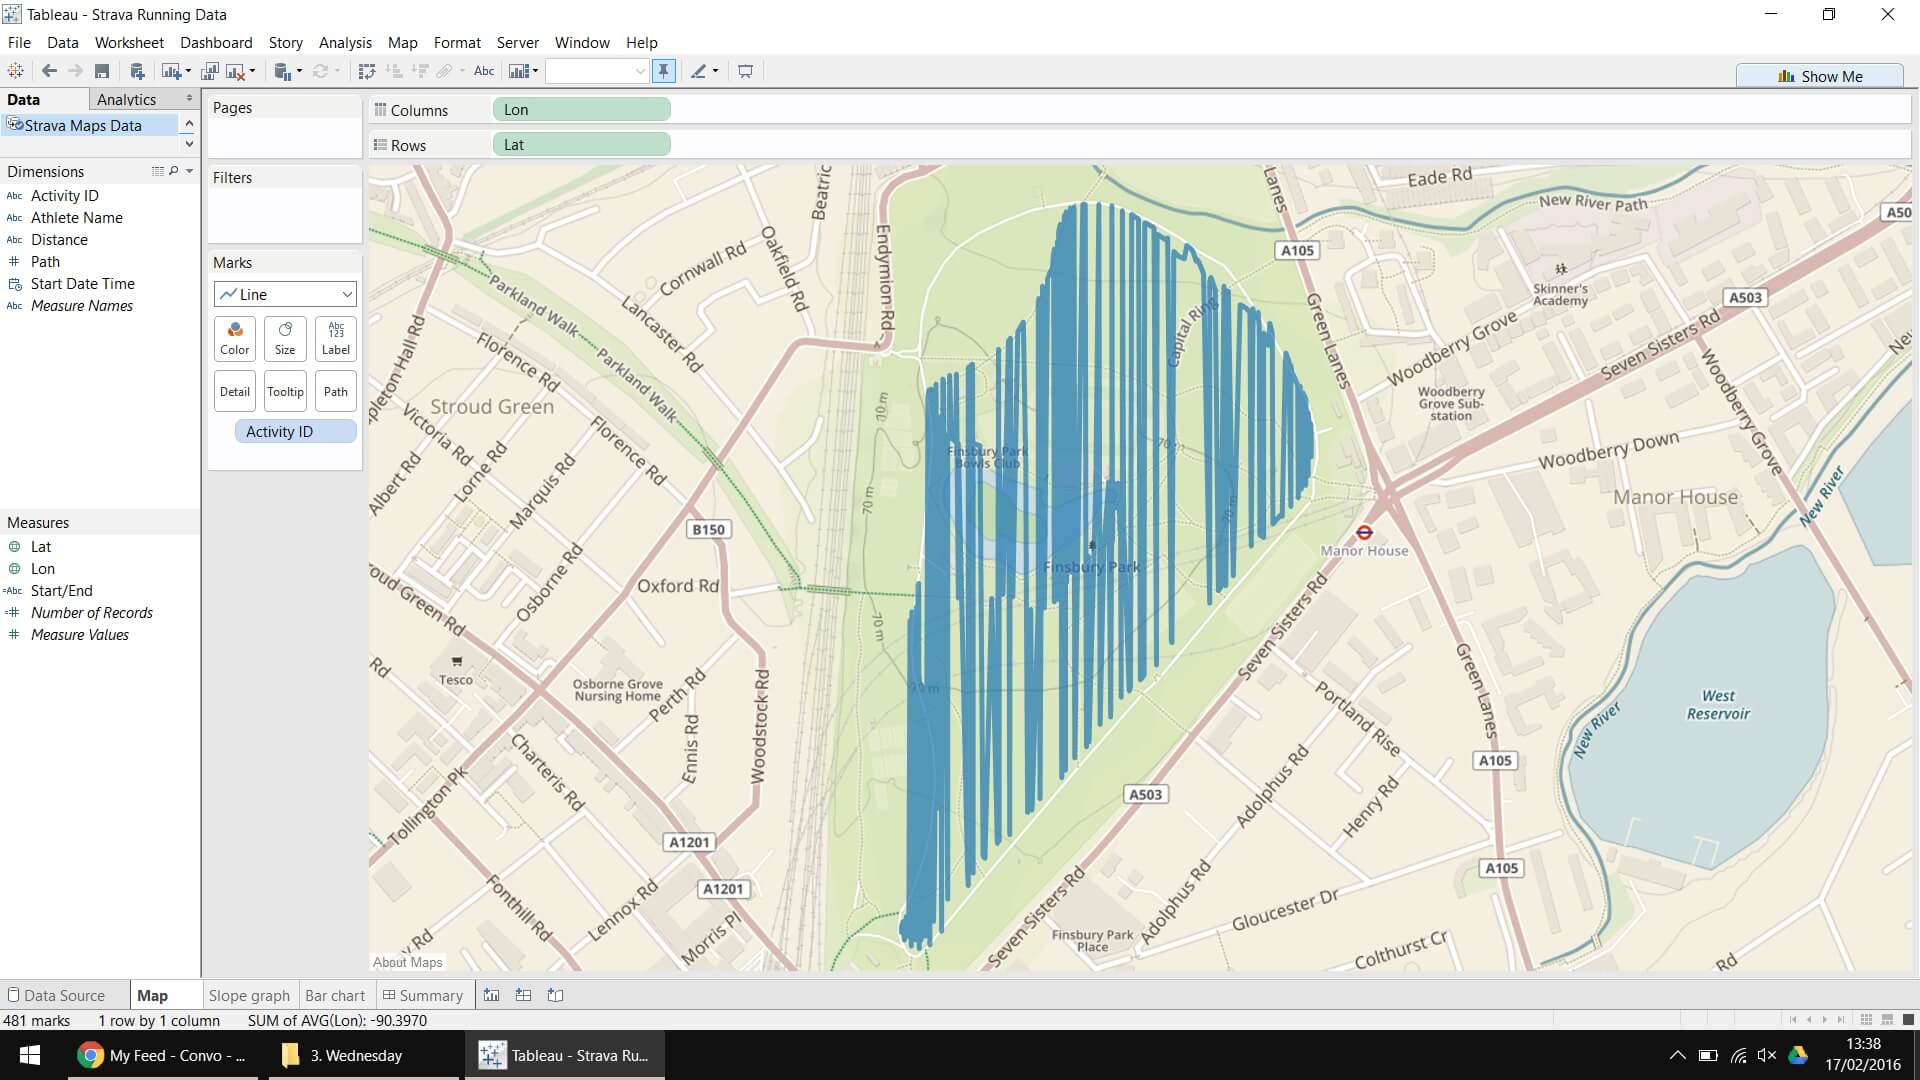
So now we have the beginnings of the map we were expecting but we can still improve this by changing the chart type to a line chart to get rid of the gaps between each point.

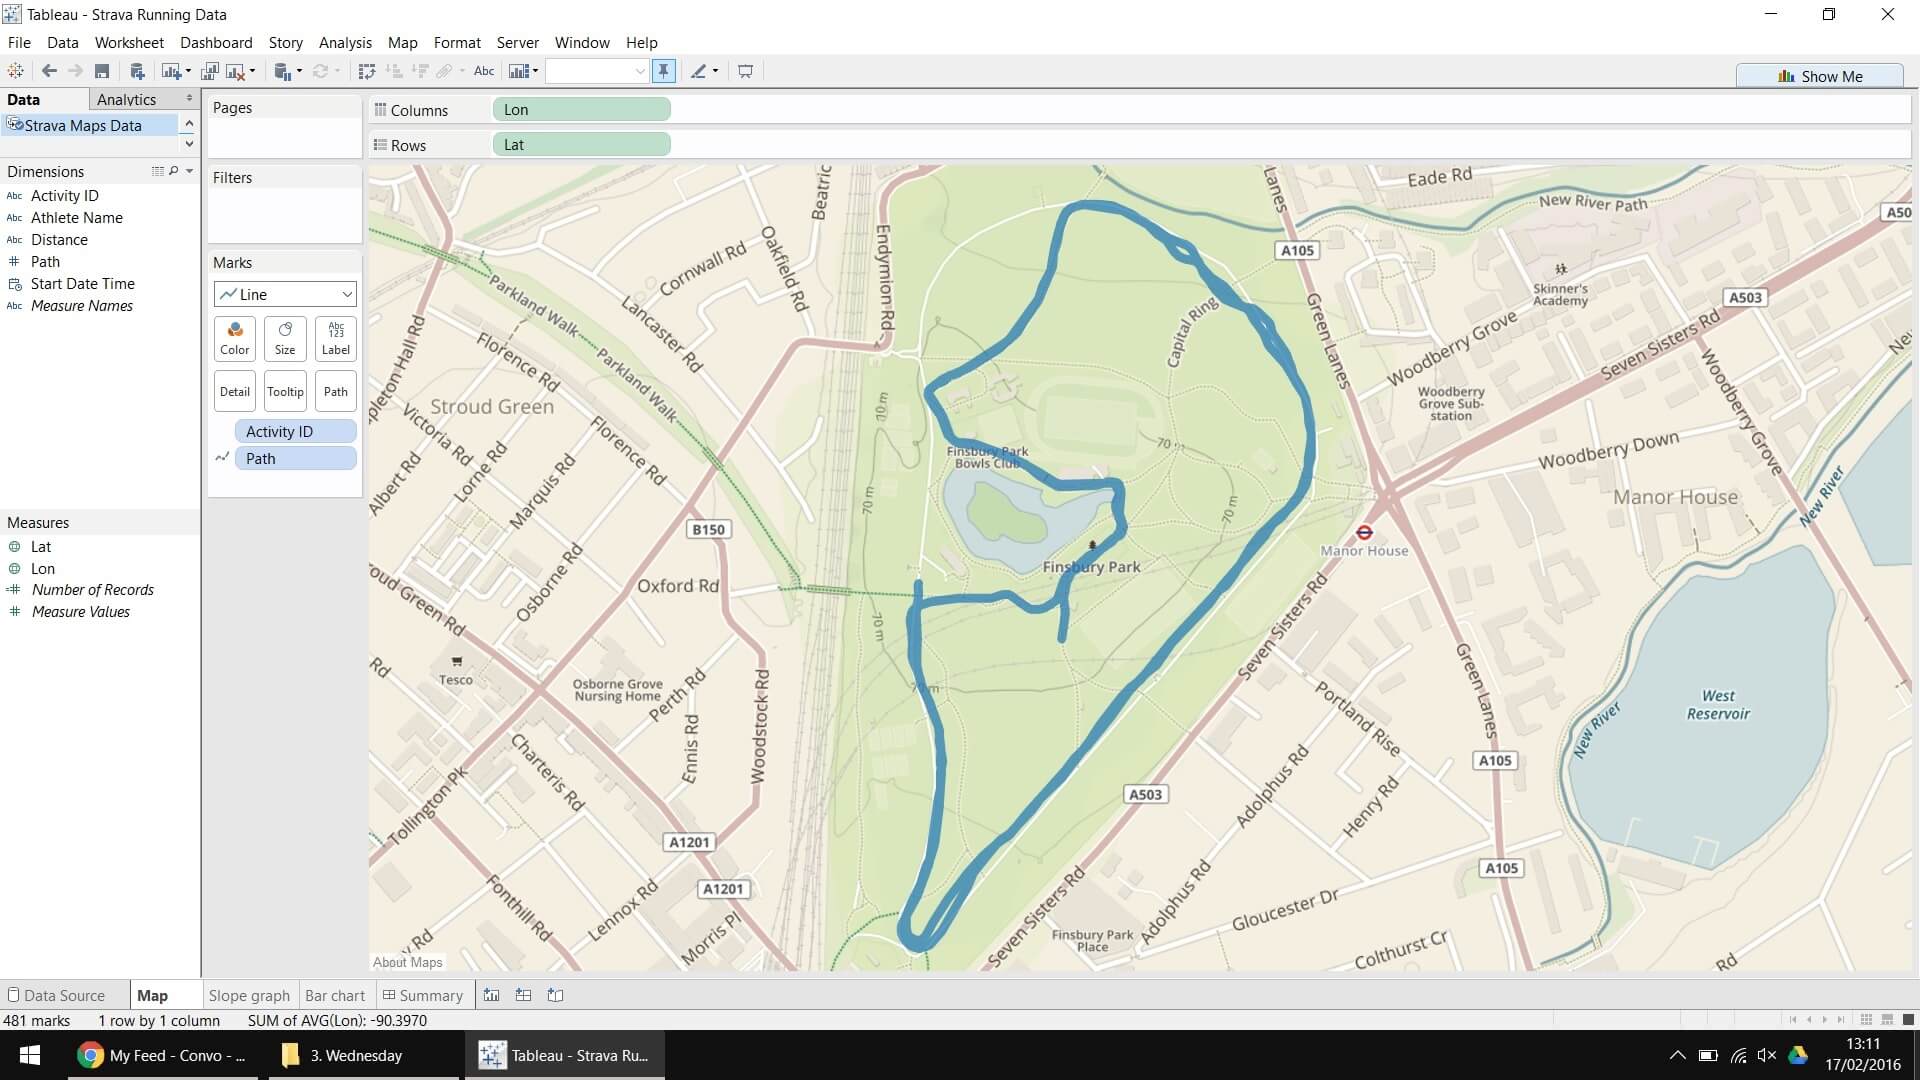
Hmmm… that’s not quite what we’re looking for; Tableau appears to have drawn a random line between every point on the map but we do now have an option on our marks card called Path so try dropping our Path field onto the marks card (at first, the Path field may be shown under Measures but simply right click it and change it to a Dimension to move it upstairs).

Hey presto, we now have a route map from the Finsbury Parkrun I ran a few weeks ago! Tableau has re-drawn the lines but between each of the individual paths i.e. 0 to 1, 1 to 2, 2 to 3 and so on.
I hope you find this trick useful, any feedback welcomed as always!
