How to create a detailed Histogram #TableauTipTuesday

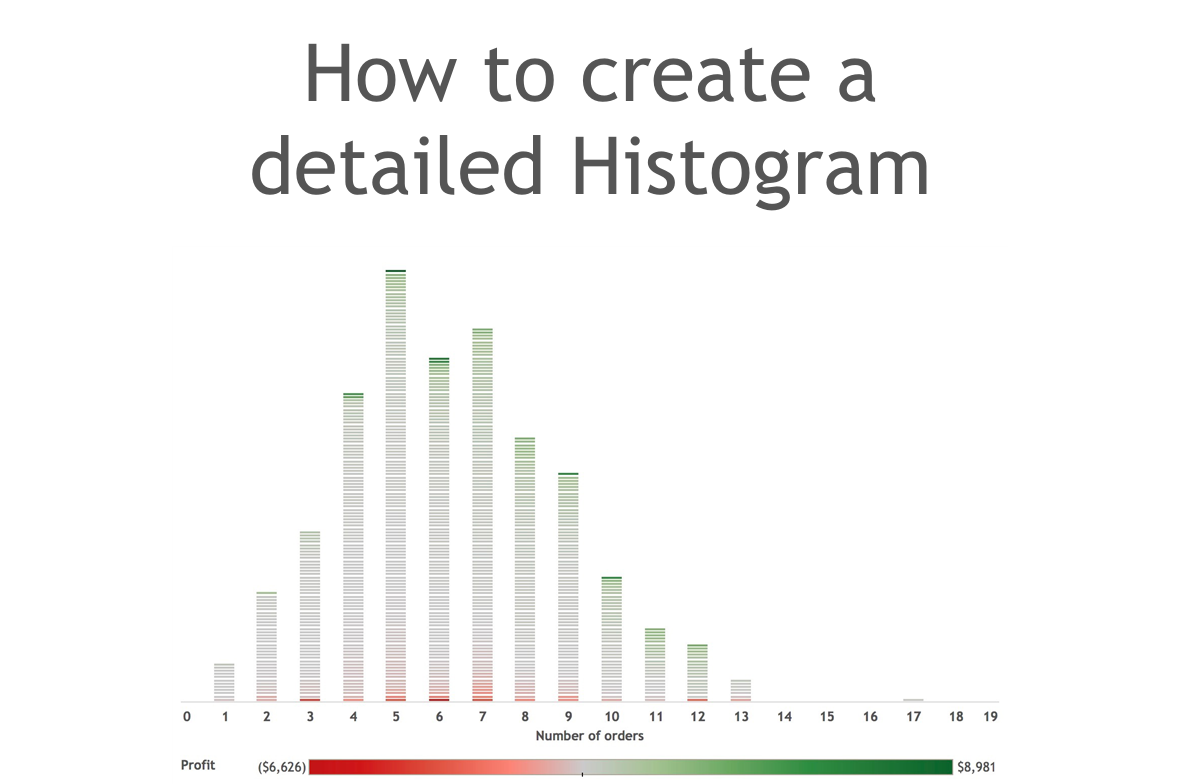
After the success of last weeks #TipWeek here at the Data School, I couldn’t resist getting in one more tip so today I’m going to show you how to create a histogram with a twist.

Title

Click on the image to open the Tip

Please feel free to let me know if you have any questions or feedback.


Author:
Rob Suddaby
Powered by The Information Lab
1st Floor, 25 Watling Street, London, EC4M 9BR
Subscribe
to our Newsletter
Get the lastest news about The Data School and application tips
Subscribe now
© 2024 The Information Lab