


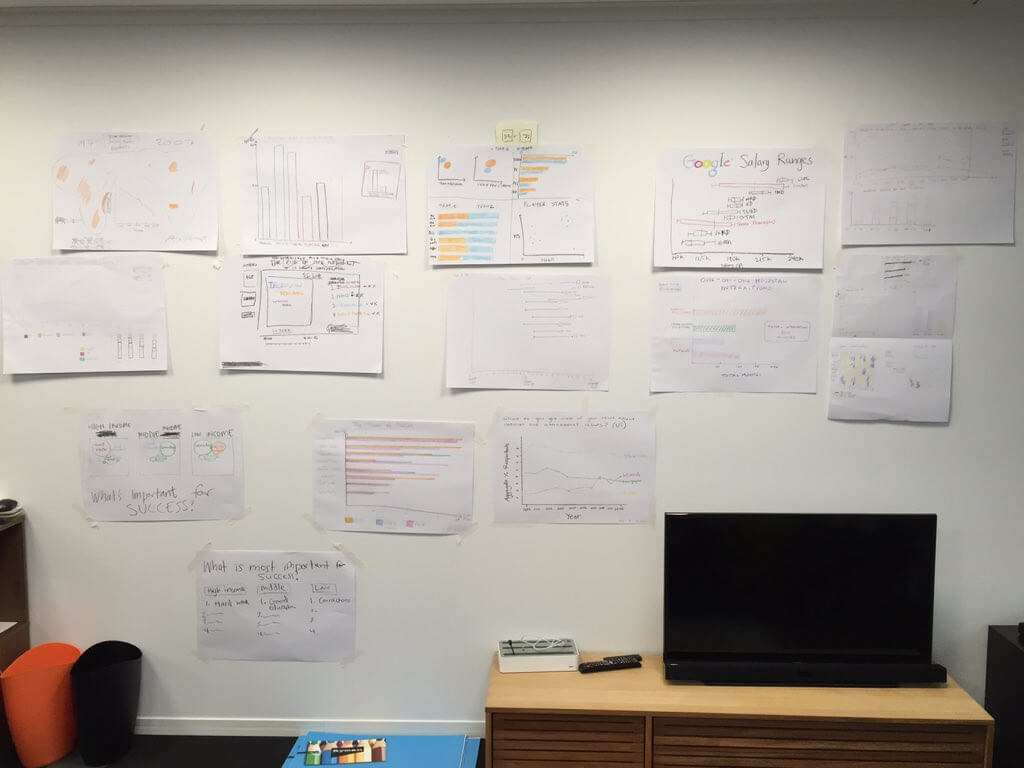
As many of you will know, our head coach Andy Kriebel writes a weekly post entitled ‘Makeover Monday’ on his blog vizwiz.blogspot.co.uk where he critiques and re-builds a viz he’s seen in the public domain. A key theme of our first week at #DS2 has been conceptualising how we would improve vizzes we came across during our best practice sessions using crayons and A2 paper, given our Tableau skills are still at their formative stages.
My awesome colleague Anuka and I were tasked with understanding and improving this viz created by South African job listing site JobVine, intended to show the top 10 salaries at Google. We instantly recognised an opportunity to simplify and improve the message that we felt it was attempting to convey as well as engaging with the casual reader who doesn’t have the twenty minutes it took us to fully get to grips with it!
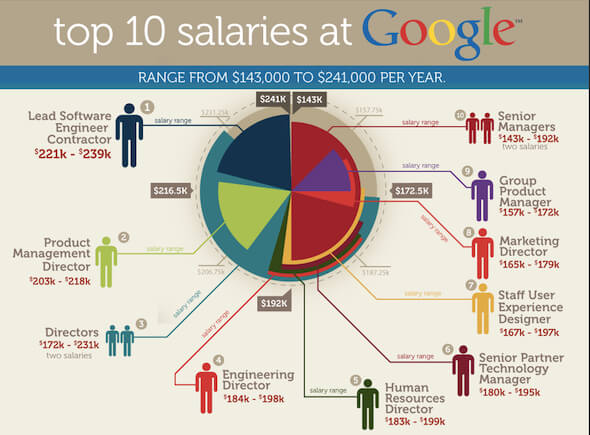
Click on the image to see the original article
We were drawn to the huge range and variability in salaries across both individual positions and the ‘top 10’ positions and wanted to use this as our theme, eventually deciding on a box plot to really drive home the variation. Coach Kriebel seemed impressed with the outcome and challenged us to perform our very own makeover in Tableau, which I have duly done.
You can see the results below and I’d love any feedback on the results, what others might have done differently and whether people think the infographic nature of the original visualisation drives people to overcomplicate what should be simple themes and messages.
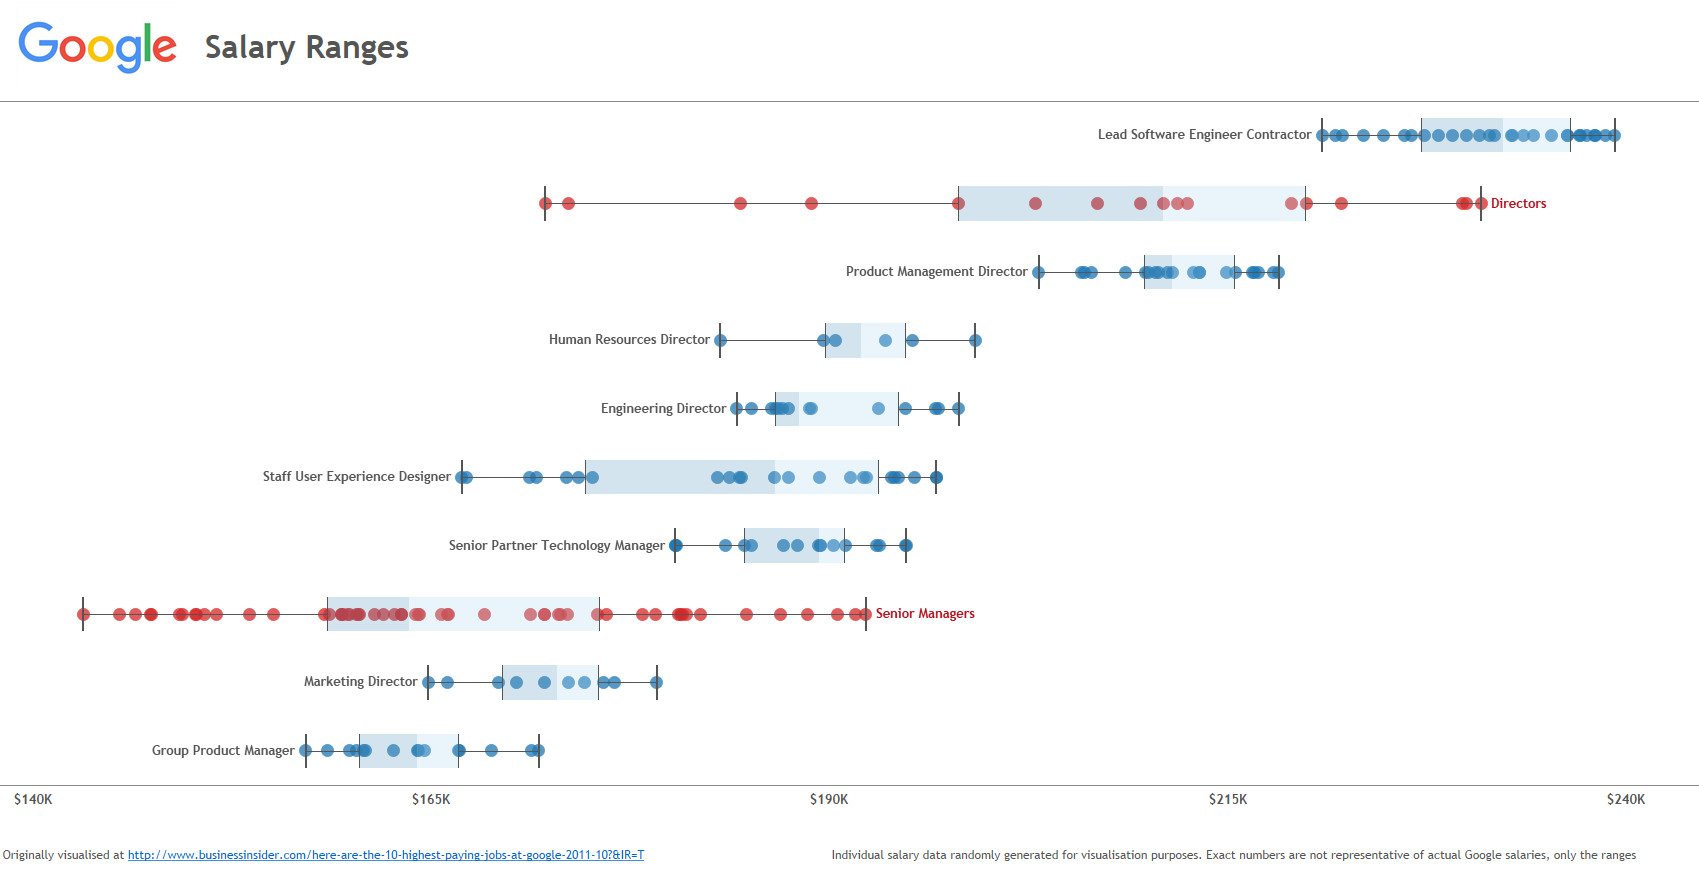
Click on the image to interact
Big thanks to our head coach for helping me work through some labelling issues in Tableau as well as fellow Data Schoolers Jules and Anuka for suggesting some ways to maximise the impact that I hope the viz will have.