A quick walkthrough on how to create combine a blended axis into a dual axis in Tableau.
Last week I came across a #WorkoutWednesday Challenge from 2017 (week 35), which required me to combine a Blended axis with a dual axis, allowing you to visualise three measures (an Average, MIN and MAX) in on one chart.
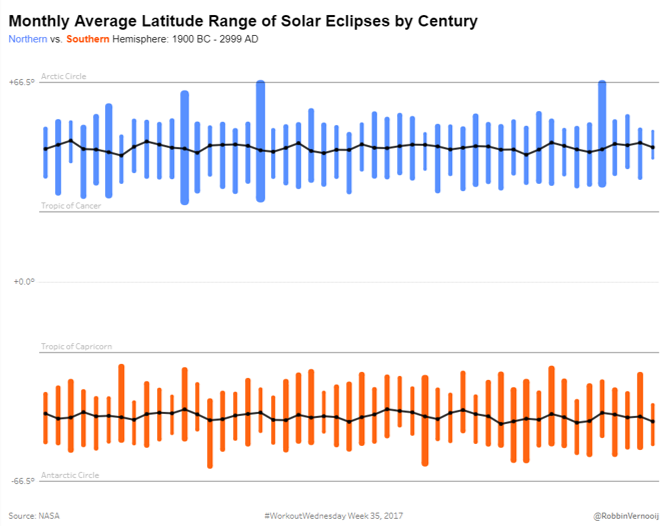
I find this a quite cool feature so I figured why not quickly write it up, so the next time you want to neatly combine 3 or more measures and don’t want to limit yourself to just a blended axis you know what to try!
1. Blended axis
For the sake of ease, I will walkthrough an example using the: Sample – Superstore data set of Tableau.
- I have both Min and Max Profit on the row shelf (right click drag profit onto rows, select min/max).
- Add your Month Order date to the columns to split up the view (right click drag, select month order date)
- Drag the Min or Max pill into the axis of the other measure, note you will see the dual ruler for blended axis show up.
- Change your month order date to discrete (right click, select discrete).
- Place Measure Names on Path. (if you have a continuous axis for your date, it will connect the measure values independently first, prior to connecting the Min with the Max, a discrete order date prevents this!)

2. Dual Axis your Measure Values
The last step is to bring in your measure to dual axis.
- Add Average Profit to the rows (right click drag, select AVG).
- Remove Measure Names from Path to reveal the line.
- Right click on AVG(Profit), select Dual Axis.
- Right click on the AVG(Profit) Axis, select synchronise axis.
- Format to your preference and all done!
That’s it for now. Feel free to contact me about any of the content on Linkedin or Twitter @RobbinVernooij