


A quick tip in how to utilise pages and change the order of animation in Tableau.
Dashboard week day 1 has flown by and I decided to use Pages in Tableau, as I have never touched it before. Pages allows you to scroll through some data to visualise trends and behaviour.
After a late afternoon change in data (as is normal for dashboard week), we ended up with Andy’s manually collected data from his trip to Rome on ice cream, beer and pizza tasting!
Download viz to check out Pages or slide through on Tableau Public (pages doesn’t work on Public)
1. Setup your Pages
Create a sheet of your liking, the example below shows the running sum of number of records (i.e. consumption) by type (beer, pizza or gelato) over time.
Drag one of your measures or dimensions to the Pages Shelf to get the page. Chronological fields such as dates are usually a good place to start to follow trends.
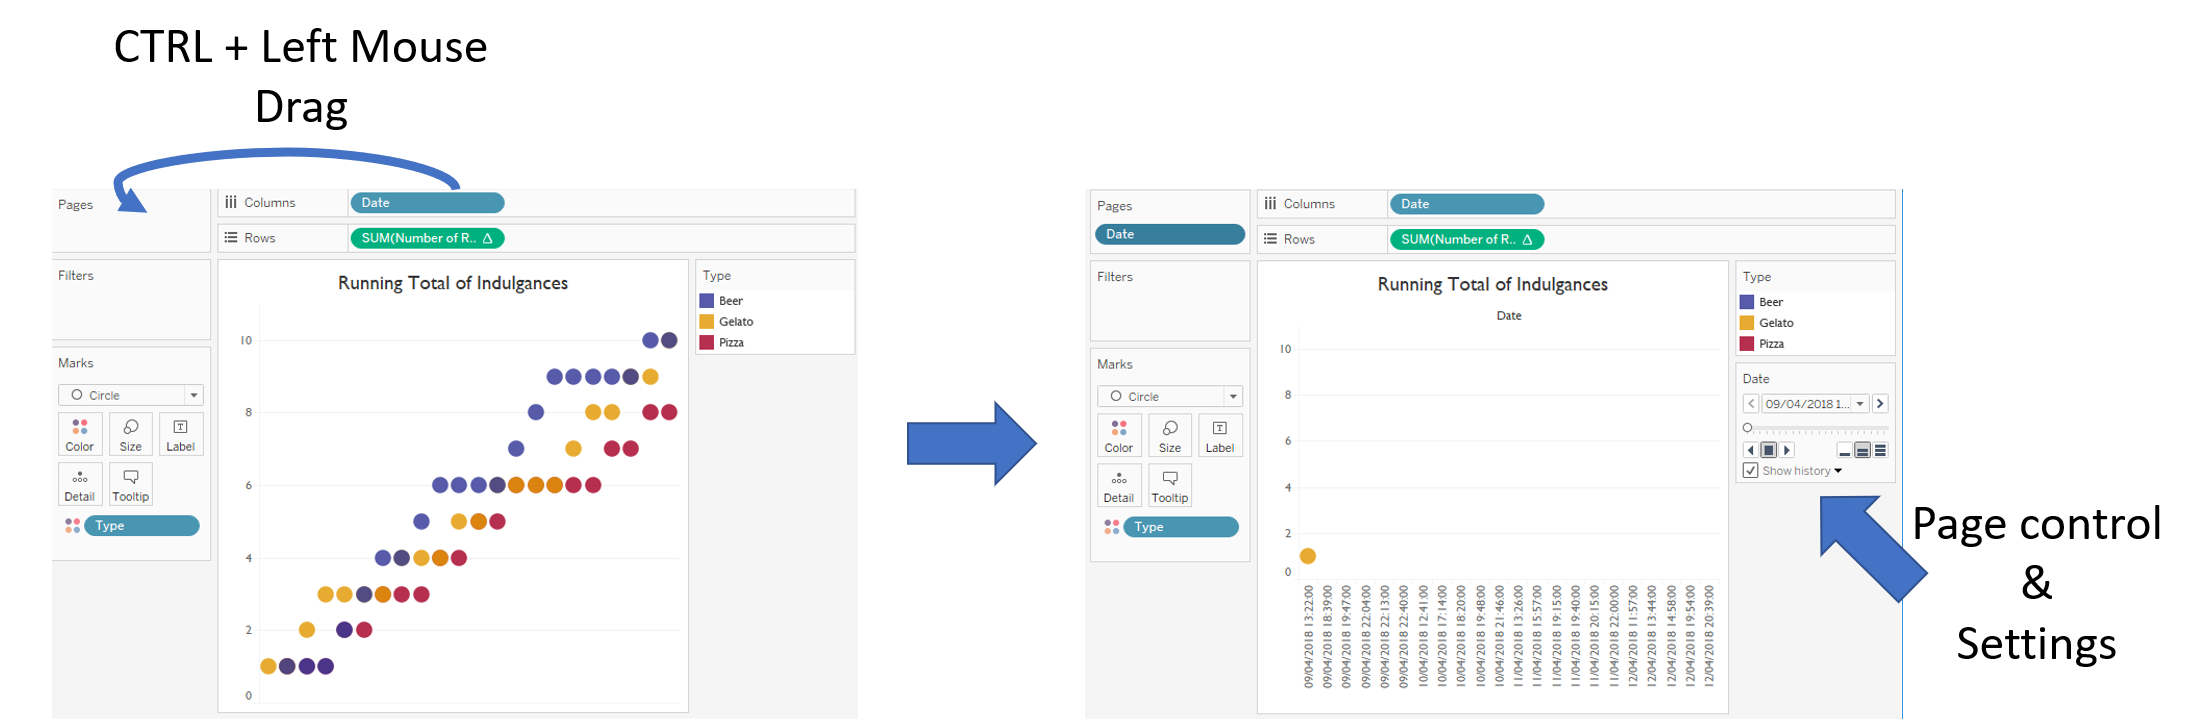
Set the speed on the bottom right of the Pages control and play forward/backward/stop with the controls on the bottom left of the box. That’s all to it! Play with history, trail and fading to create stunning animations to enhance your data.
2. Order of Animation with Pages
With only one discrete field on the pages, it will cycle through the dates and reveal everything in your view instantly when a date cycles through, like the example below of the chart shown just before.
By adding an additional discrete field to the Pages shelf you can add a second order to the animation, such as Type. It will cycle through the discrete fields based on the order on the Pages shelf.
If Type sits above Date, it will cycle through the Dates by Type first, whilst the other way around will slowly reveal the Types per date. This allows for infinite possibilities (or finite if you manage to crash Tableau).

That’s it for now. Feel free to contact me about any of the content on Linkedin or Twitter @RobbinVernooij