


This blog will give you a brief introduction to social network analysis (SNA) with Alteryx. In the first part of the blog, you’ll get insights into the basics of SNA. Afterwards, I will explain an application example with Alteryx.
1. Introduction into social network analysis
Social network analysis helps to analyze social structures with the help of networks. A social network can consist of persons or objects. In graph theory, these are called nodes and are represented as points within a diagram. If different nodes are related to each other, they are connected by lines. These lines are called edges.
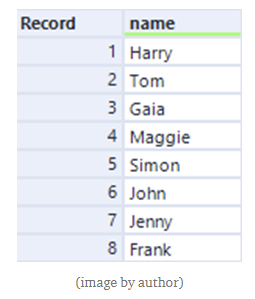
Let’s consider a social network consisting of 8 people. Not all 8 people are in contact with everyone. For example, it may be that one person within this network is in contact with only one other person. We attract the following persons for the example.
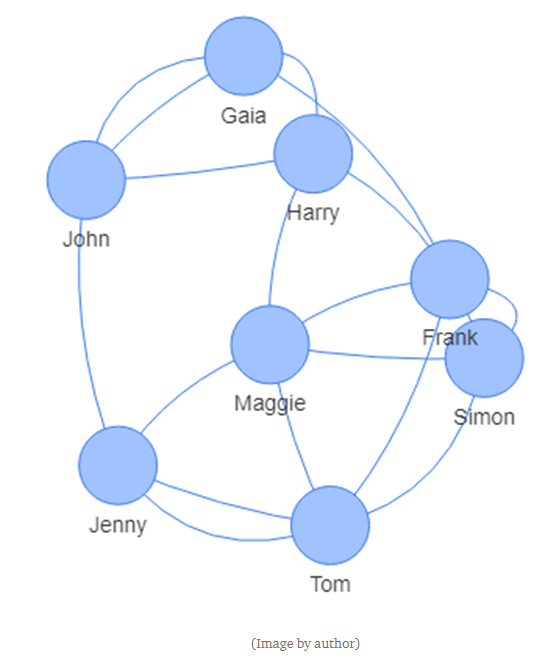
We would like to know which people are connected in our social network. This could be obtained with data on followers or a friends list. Since there are many people who are open with their data on social network platforms, there should be no technical complications in obtaining this data. A possible network could be visualized as follows:
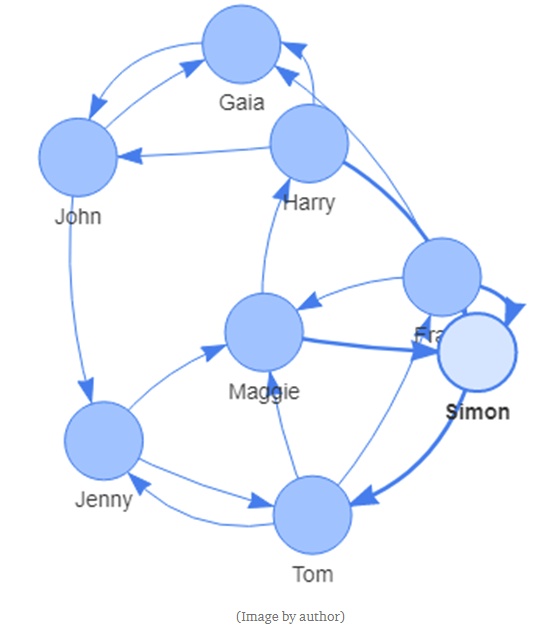
There are some nodes in this example that are doubly connected. An example of this is Jenny and Tom. This phenomenon occurs because the relationships between two nodes can go in both directions — Jenny can follow Tom on a platform and Tom can also follow Jenny. The direction of the relationship becomes clearer when you add a direction to the connections.
We can use the visualization to get an overview of which people are connected in this network. However, the answer to the mere question of a connection is not enough for valuable insights. Suppose we are the head of the marketing department of a company that produces a beverage for the masses and we are looking for a suitable person who has a large reach within a network so that he can promote our product — We are looking for an influencer, and the most important one within a social network.
How do you measure the importance of a node?
The question of the most influential person within a network is not so easy to answer. For example, we could assume that the most influential person within a social system is the person with the most connections to other people — that is, the nodes with the most edges. This measure is called the degree of a node.
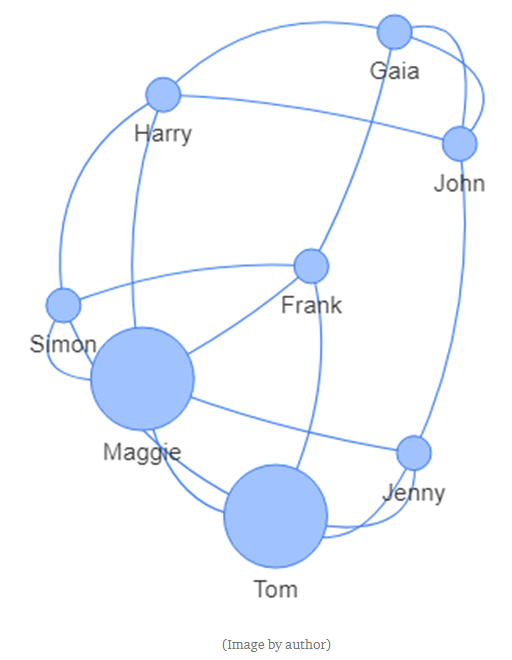
The larger the node in the network diagram, the more influential the person shown is in that particular network. According to the degree of the node, Tom and Maggie seem to be the most influential people in this network, as they have the most connections to other nodes with 5 edges.
However, the degree of the node is not always the appropriate measure to describe the importance and influence of a node within a social network. If you look at the hierarchical systems of large companies, there is usually a boss who passes on instructions to a number of management members. These pass these instructions on to more and more employees in stages. In this example, the influence of individual employees would not be well described by the degree of individual nodes, but also the influence of neighbors. A neighbor of a node is described as all nodes that are directly connected to each other. For a simple modeling of this hierarchical structure, the Betweenness Centrality is a suitable measure. For this measure, the shortest connection between each pair of nodes is determined. The size of the value for each node is then created by the number of shortest connections in which the respective node is involved.
To better illustrate this, let’s take the example of the structure of a company:
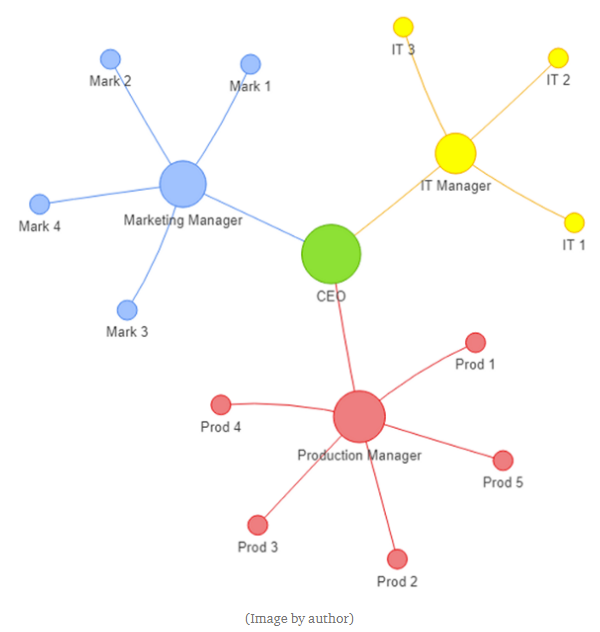
To determine the betweenness centrality for the IT manager, all the shortest paths that pass through the IT manager are counted. The connections directly to the IT manager are of course neglected in the count.
The IT manager is the only one who has connections to his employees (IT 1, IT 2 and IT 3). This means that all connections to the IT employees must necessarily go through the IT manager. So there are 5*3 = 15 shortest connections from the marketing department to the IT staff, 6*3 = 18 shortest connections from the production department to the IT staff and 1*3 = 3 connections from the CEO to the IT staff. In fact, we have here the unrealistic case that the IT employees do not maintain any contact with each other, only and exclusively via the IT manager. This means that we have to count an additional 3 connections (IT 3 — IT 1; IT 2 — IT 1; IT 3 — IT 2). In total, we arrive at a Betweenness Centrality of 15+18+3+3 = 39 for the IT manager.
Sometimes the question arises as to which nodes within a network can scatter information through the network particularly efficiently. Here, one can fall back on the Closeness Centrality. There are basically two ways to calculate this. Alteryx forms the inverse of the sum of the shortest distances to a node. The CEO can reach all three managers in one step and all 12 employees among the managers in 2 steps each. So the inverse of the sum and thus the Closeness Centrality of the CEO is 1/(1*3+2*12)= 1/27≈0.037.
There are several other measures for centralitys, but that is beyond the scope of this blog post.
2. Application of the SNA in Alteryx
Find the perfect influencer for your product
As already shown in the first part of this blog, SNA can be used to identify influencers who are suitable for advertising the product. In addition, by classifying influencers into categories, such as fitness, nutrition,… you can find out followers who follow multiple influencers. This helps to define the target audience more precisely and to understand which influencer contains the most followers of your target audience. Let’s illustrate this with an example:
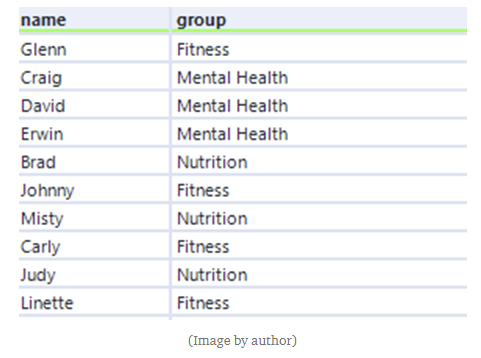
You work on a marketing team as a social media manager for a company that wants to launch a new product. The product in question is a fitness bar. You have a list of 10 influencers that you classify into the categories Mental Health, Fitness, Nutrition.
Also, you have a list of individuals who follow these people.
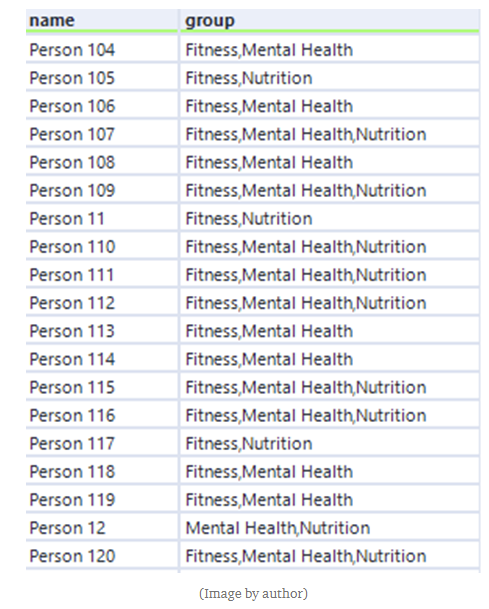
In total, the list of followers includes 1000 people. With regard to the followers, the “group” column records the areas in which they follow at least one influencer. For example, person 104 follows at least one person from the Fitness area and one person from the Mental Health area, but no one from the Influencer list who is in the Nutrition area.
The “group” column is important because it allows us to define our target group more precisely.
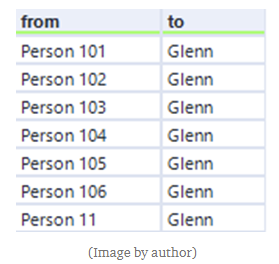
In addition to the follower-influencer table, we have a “from-to” table. This tells us which follower (from) follows which influencer (to).
Conducting social network analysis in Alteryx
For the implementation we use the Network Analysis Tool. This requires as input a table that contains the name of each node (our follower-influencer table) and between which nodes there is a connection (from-to table).
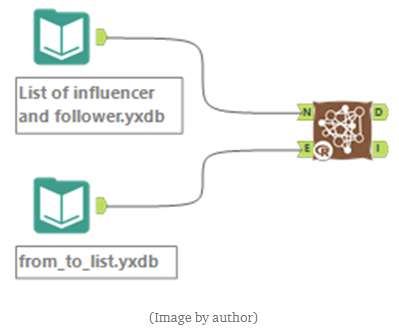
It should be noted that the Follower-Influencer table contains a column titled “name”. Likewise, the table that flows into the E-input of the Network Analysis Tool must contain columns with the names “from” and “to” to pass the connections.
The configuration is very straightforward:
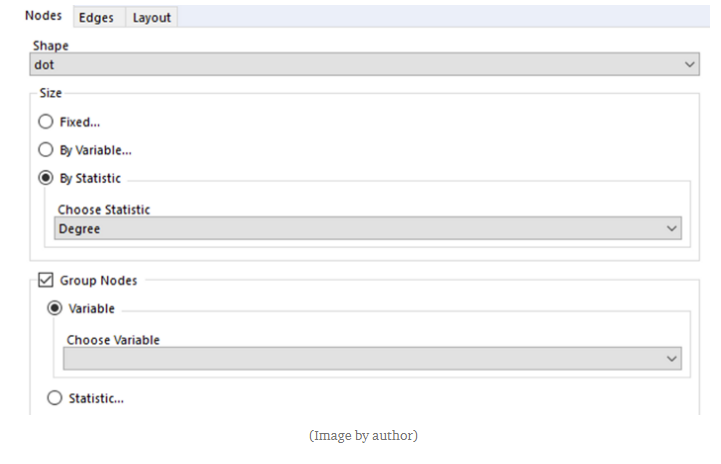
You select the form in which the nodes are to be displayed and the desired dimension that determines the size of the node. For this you have the option “fixed”, if you don’t want any size differences in the nodes, “variable”, if you want to define the size user-defined via a column or the option Statistic, which uses the measures already discussed in the first part of the blog. For our analysis, we use the degree measure because we are interested in targeting as many direct followers as possible.
The optional “group nodes” function allows you to group the nodes either using statistics or user-defined.
Interpretation of the results
In the I Output of the Network Analysis Tool you get a visualization where you can highlight individual nodes and their direct connections. The output of the current table looks like this:
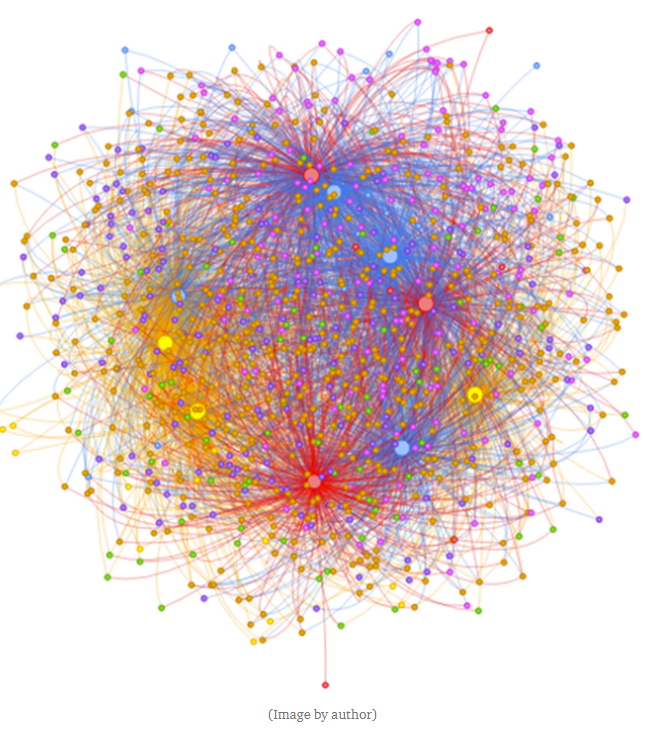
The different colors represent the respective groups in which either the respective influencer is active or the one the follower follows. The relatively larger dots represent our influencers.
This visualization does not provide any added value yet, except for the info on how complex the social networks can be. Since we haven’t exactly defined our target audience yet either, let’s do that now. We decide we want to reach followers who follow both at least one fitness influencer and at least one nutrition influencer. This means that we filter out all other followers from the analysis. We get the following result:
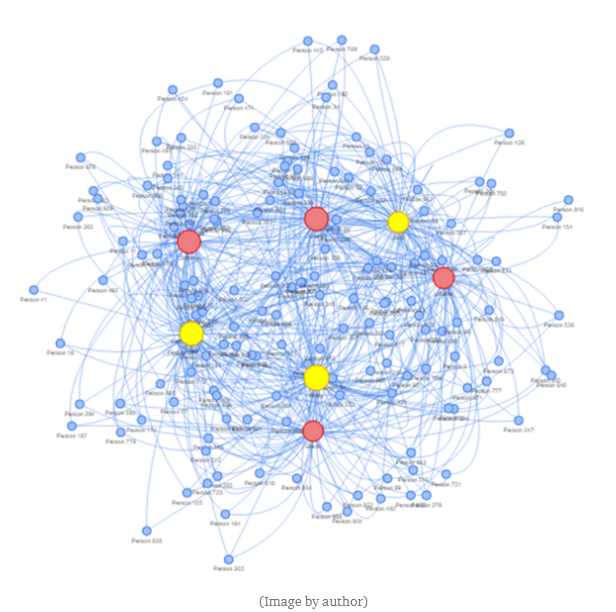
Accordingly, there are 7 followers that are still relevant for us. The nutrition area is colored in yellow and the fitness area in red. The insight we can draw from this visualization is that we cannot visually identify such serious differences between the individual influencers.
But what is the best way now to find out which influencer could promote our fitness bar most effectively?
The answer lies in the D-Output of the Network Analysis Tool. There we get a table with each node and all its Centricity Measures. If we sort these in descending order by “degree” using a sort tool, we can see directly which influencers come into question for us. With the sample tool, we then show only our 7 influencers:
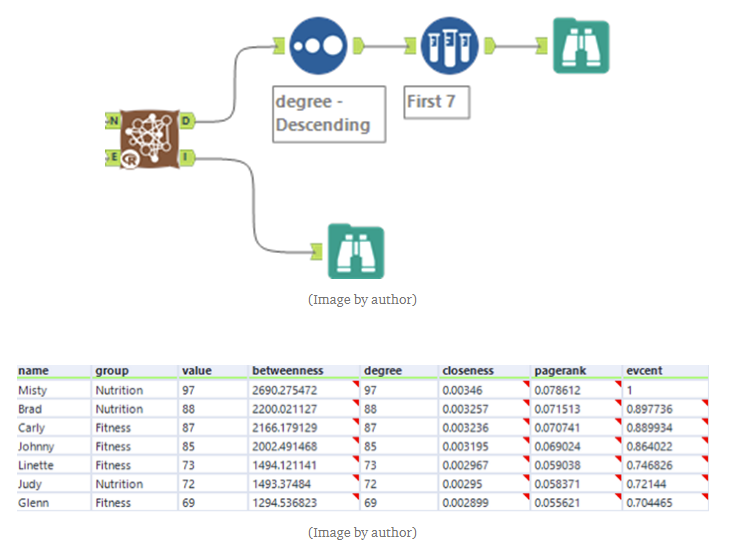
We see that Misty reaches the most people from the target group with 97 followers. This is followed by Brad with 88 followers and finally Carly with 87 followers.
So as social media managers, we might consider making an offer to Misty first. If we want to engage several influencers, we should not take combinations from the areas of the influencers themselves for the grouping of the followers, but identify which followers follow exactly which influencers. That way, we could avoid the problems of reaching the same follower multiple times. Or vice versa: We could, if desired, reach exactly the same users multiple times via different channels. But more concrete analyses are also beyond the scope of this blog.