


Of course, there are different ways to use a Show/Hide Button on your dashboard. I want to show you one of them.
When you design a dashboard with lots of parameters, actions or filters such a button is the easiest way for a stranger, who wants to use the dashboard, to create an explanation button with information. But instead of just having one button with information you can also create a “second layer” by using the Show/Hide Button.
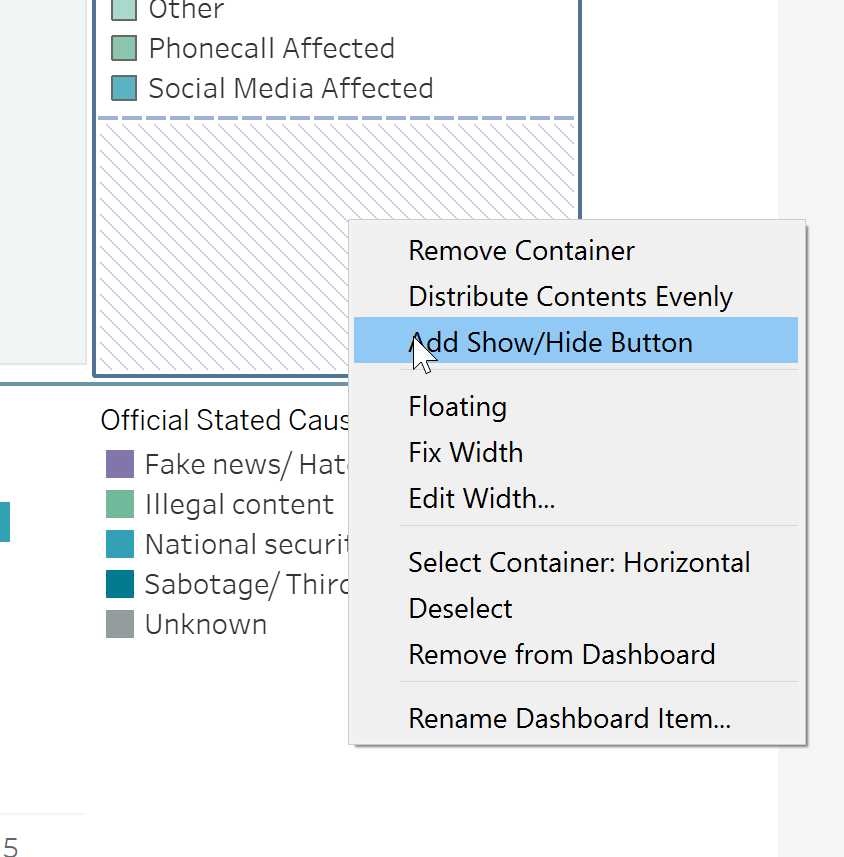
1. To get it on your dashboard you can click in a container and choose the option:
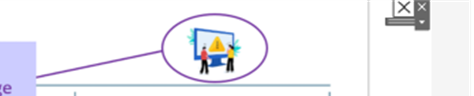
2. A little cross X will appear directly on your dashboard in a little floating container. Now you can click on it and put it on the position you want it to be.
3. Before you start to edit the button, drag a vertical container on the dashboard. In it you can put the image, graph or whatever you want to show by clicking the button.
4. Now you can start editing what it should show when the user clicks on it and its layout:
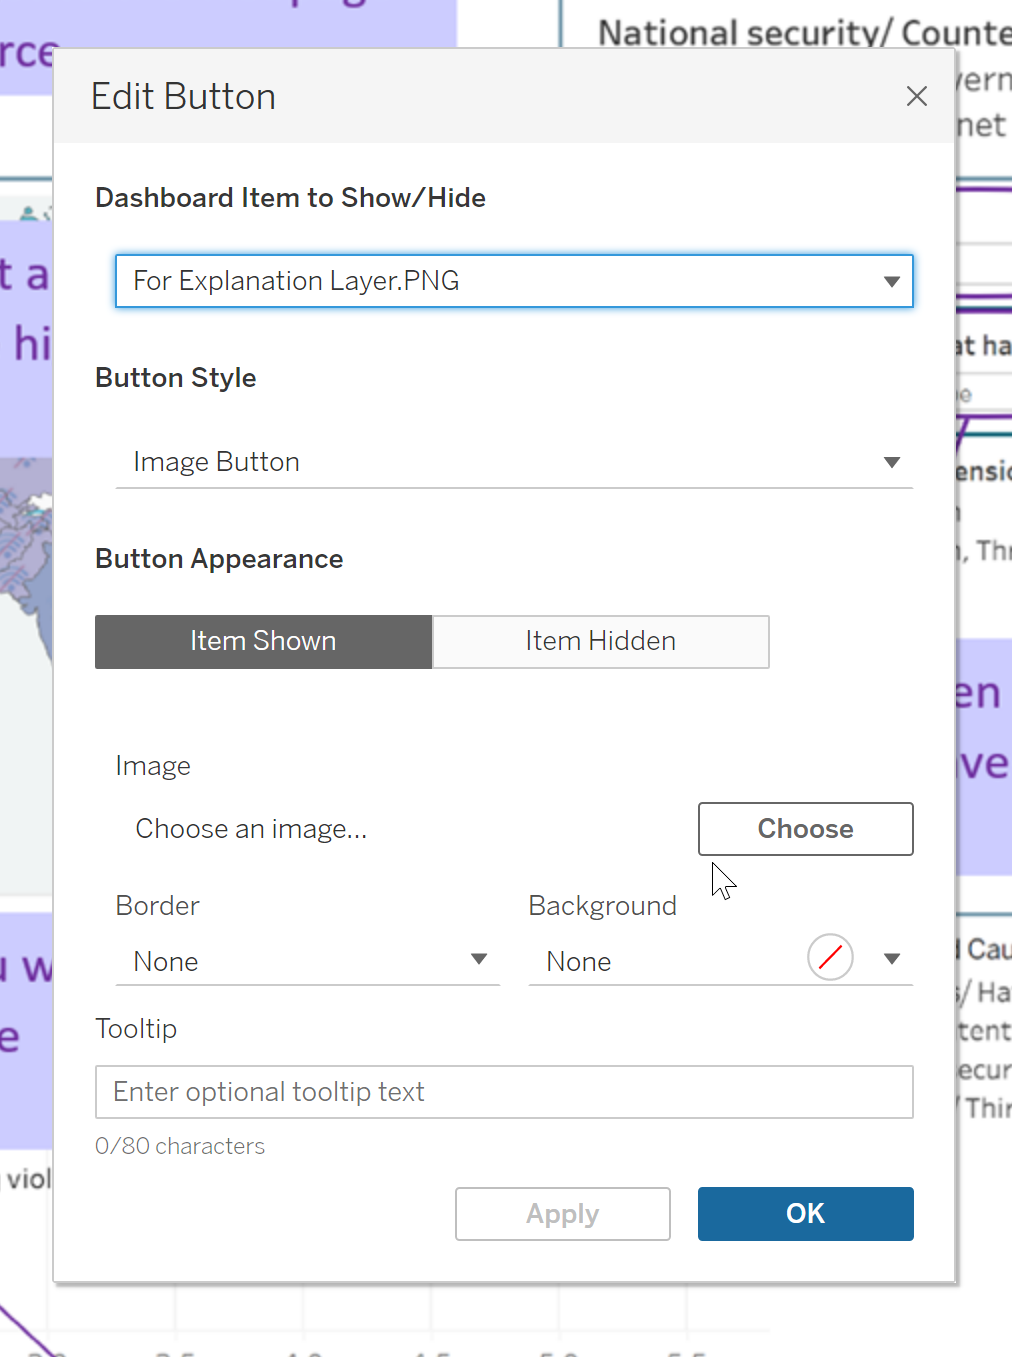
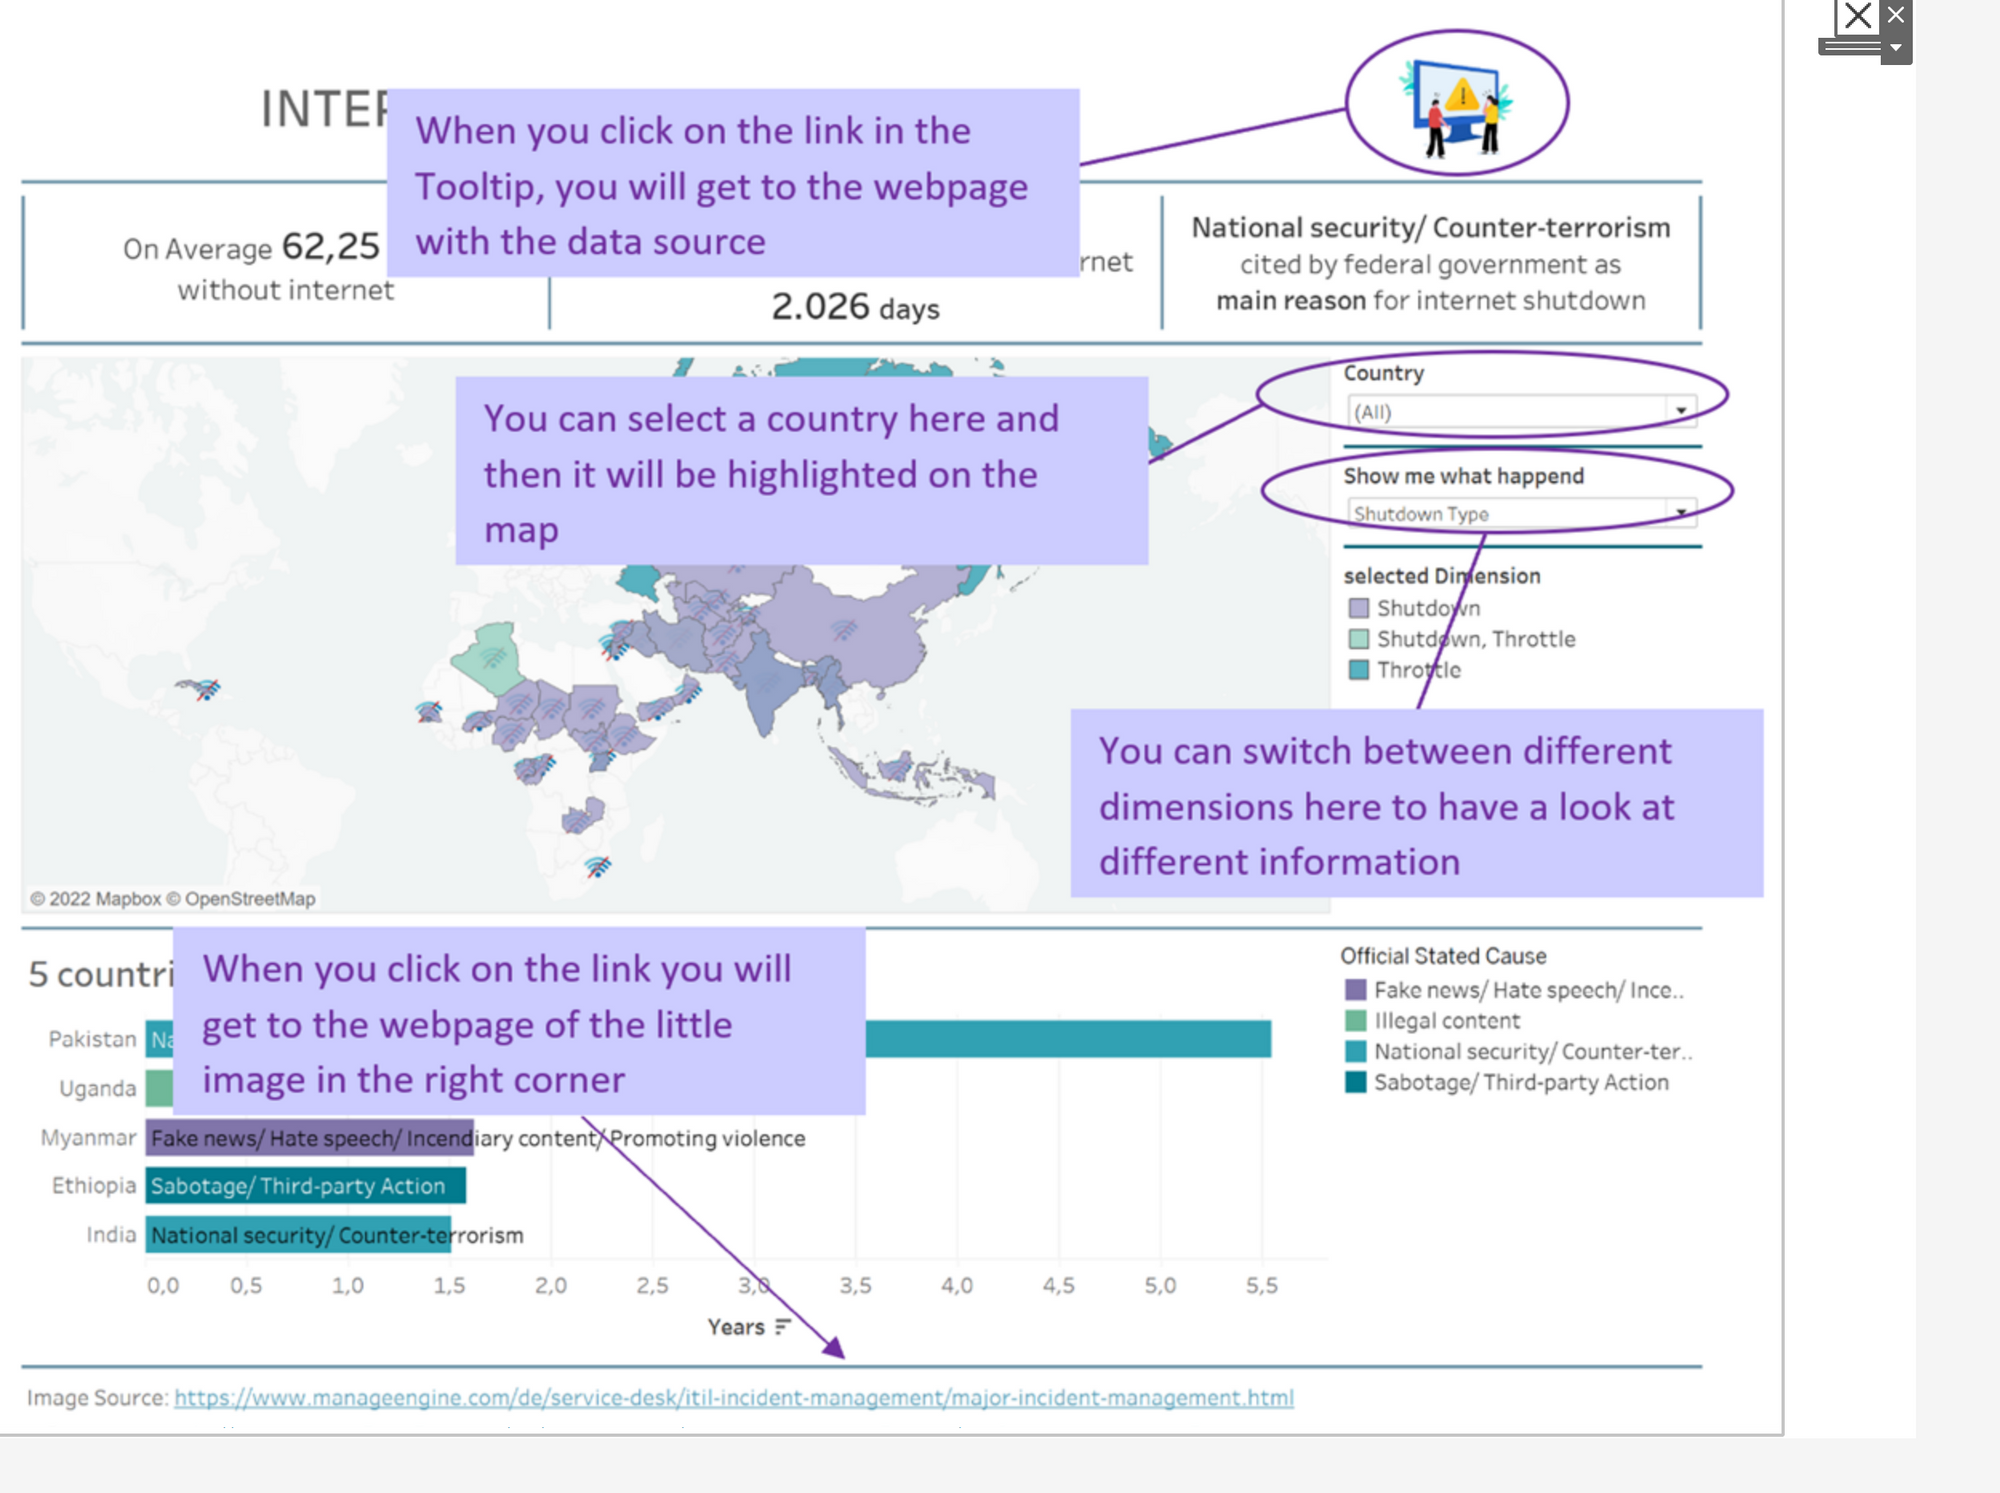
5. I chose an image I created before. ⇒ For that I made a screenshot of the final dashboard. I edited the screenshot image with the different purple explanations you can see in the beginning of this blog. This way I can create the illusion that everything is described with little textboxes and arrows when the button is on ‘Show’.
6. The image will show up when you press alt (Windows) + click on the three bars and will be hide by hold alt + click on the X. On Tableau Public the user simply has to click on it without holding alt. (If you want to give it a try you are very welcome to view the dashboard on my tableau public)
7. I wanted to have second layer when it is shown. So, I used the option to change the vertical container (with my image) to a floating container. Then I dragged it to the right size of the “original dashboard” with the mouse.
8. In the Edit Window you can see that you can change the image of the button in Hide Mode and a different one in Show Mode (I didn’t change anything for now).
9. With a little trick (make the based dashboard size a little bit bigger in the width) you can have the little cross (Hide/ Show Button) straight in the corner without touching any other graph(ic).
10. Now it is done and a user who has not had a briefing on how to use the dashboard knows how to use it 😊