


Hello and welcome to my first blogging attempt. While embarking in the field of analytics a year ago, I was struggling myself to understand the topic, and therefore I decided now that I had my first week in Tableau training at “The Data School Deutschland” to make it the topic of my blog. The greatest fear in life is always that of not being understood. That is very much true for a data analyst who not only need to find insights from the data but also to be able to convey those insights to audiences with different backgrounds and interests.
The best way therefore to overcome the fear of not being understood in the context of analytics is what is often coined in the field as “guided analytics”. Although “data analytics” might be understood as explaining different things to different people, Guided analytics is a sub-field at the interface of “visual analytics” and “predictive analytics” focused on the development of interactive visual interfaces for business intelligence applications. Such interactive applications serve the analyst to take important decisions by easily extracting information from the data. During the first week of our training here at the Data School I learned the following techniques to be implemented in Tableau visualizations.
Below are the steps to better analytics:
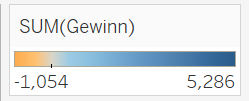
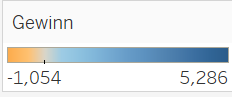
1. Titles and filters:
It is important to captivate our audience by giving intuitive names to the filters that we apply. Avoiding the default title to be created at the time we create our filter will make easier for the audience to follow up and take action quickly. So instead of the first filter name it is the preferred approach to use something in the lines of the second picture(right).
2. Subtitles that empower titles:
Although titles are the bread of formatting in Tableau so as our visualization can be easily digested by the audience, the subtitles serve as the butter that will make it even more easier for them to interact with the dashboard, adding therefore more context. In the example below.
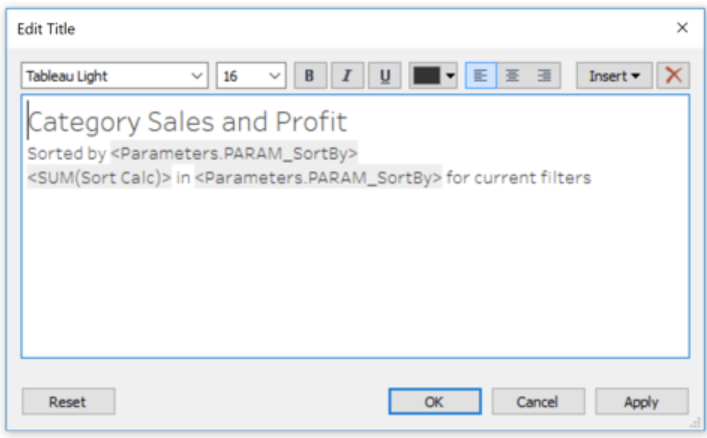
3. Filter selection with dynamic titles:
It is often the case that the audience might find it difficult to follow track after a few clicks on the data being filtered in and out of the view. It is recommended that by adding dynamic titles, we can contribute to more clarity, by allowing the title to update based on the user’s selection. This will allow the end user to better understand and keep track of the visualization.
The insert function in the “Edit Title” window will enable us to embed the selected field into our title.
4. Filter actions:
Selecting a filter is usually done in a way that we anticipate the end result how it's gone look like. Action filters can instead enable the end user to choose best what their eyes will catch. To achieve this result we can make any sheet filter to be the rest of our dashboard either by selecting the funnel icon in the sheet toolbar or we can select the “Actions” under the “Dashboard” in the menu and “Add Action -> Filter”.
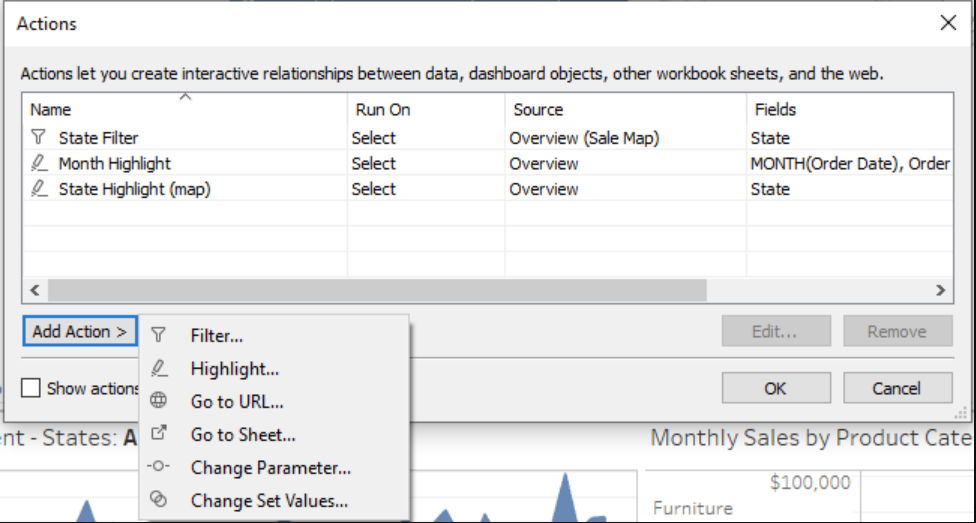
Filter actions will thus give the audience the ability to filter views directly from a tooltip.
5. Enable detailed tooltips:
Practically, any field on our view will end up in the tooltip. Making therefore tooltips more relevant, we can remove duplicate information and restructure the text to make it more readable. This in turn will highlight important information that will guide the audience.
6. Gain control with filter selection:
Once we have completed the tooltip with the required metrics, the end user will be able to interact directly with the tooltip and give life to the visualization by highlighting related marks and outliers.
Enabling “selecting by category” in the Edit Tooltip dialog box will allow the end user to gain greater control.