


Welcome to the Tableau Next Blog Series!
In this 5-part series, I’ll walk you through the end-to-end process of working in Tableau Next — from loading data all the way to building a functional dashboard.
Looking for a summary of what Tableau Next actually is? Follow this blog: What is Tableau Next?
This blog is about building a Semantic Model in Tableau Next using Data Objects. It’s based on the latest version available in July 2025.
What We’ll Cover
- Uploading Data Objects into a Semantic Model
- Creating Relationships between Data Objects
- Creating a Logical View
- Creating a Calculated Field
- Creating a Metric
- Creating a Parameter
Uploading Data Objects into a Semantic Model
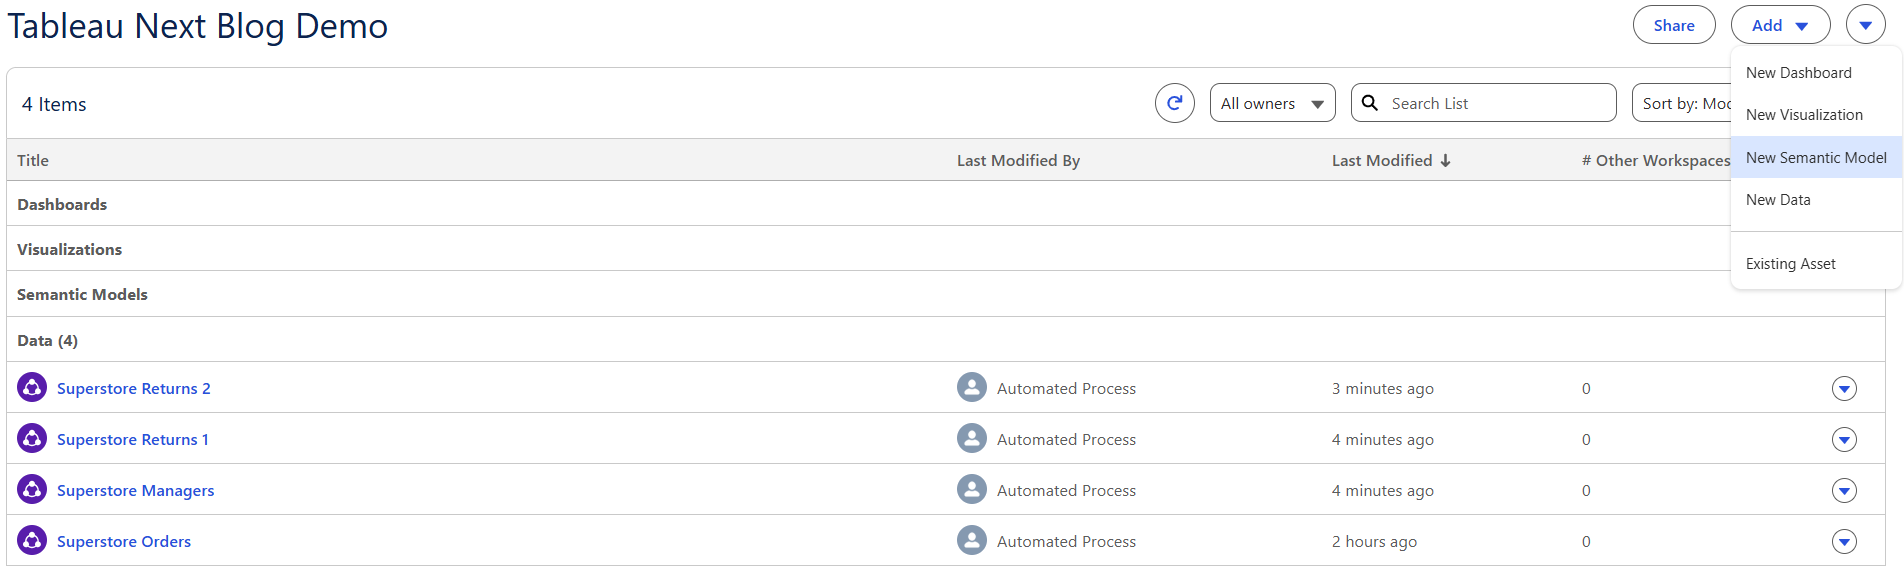
In the image below, we have the four CSV files (aka Data Objects) we uploaded in Part 1. To start building a Semantic Model, click Add (top right), then select New Semantic Model.
You'll be asked to choose a starting Data Object — for now, you can only pick one. I’m going with the Superstore Orders file.
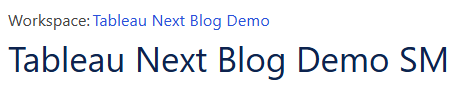
Once selected, a new window opens where you can name your Semantic Model on the top left.
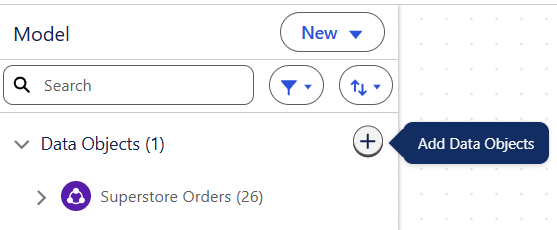
On the left pane, you’ll see:
- The current Data Object you’ve uploaded
- Options to search, filter, and sort
- A + button to add more Data Objects
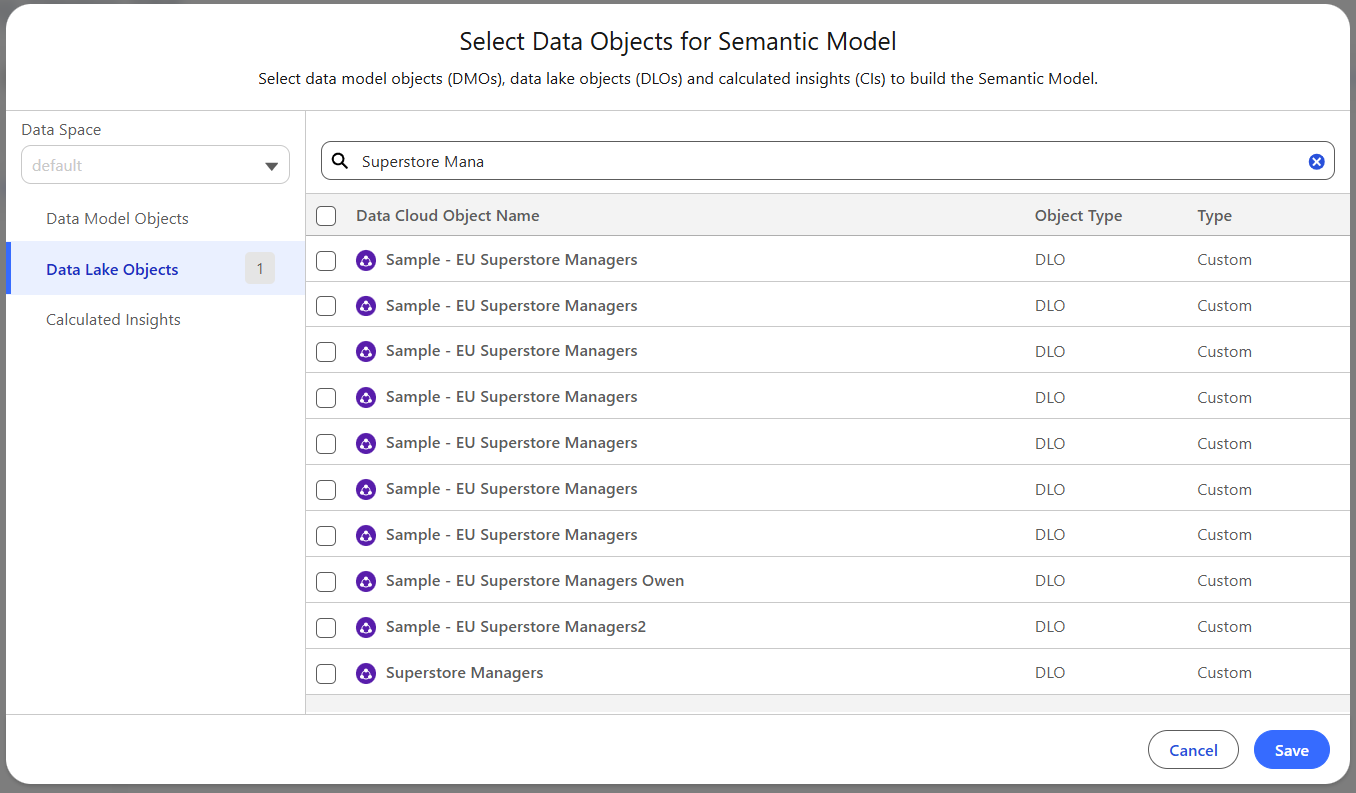
Clicking the + opens a UI where you can choose between Data Lake Object, Data Model Object, and Calculated Insights.
What's the difference between the three?
- Data Lake Object: Raw datasets directly uploaded into Tableau Next (like CSVs or Snowflake tables). These are your untouched, source-level files.
- Data Model Object: Curated data that’s been shaped for analysis — you’ve maybe joined tables, renamed fields, or cleaned it up. This is the ready-to-use version of your data.
- Calculated Insights: Custom metrics or KPIs built using logic or expressions (like calculated fields in classic Tableau). These give analytical meaning to your models.
You can think of it like this:
Data Lake Object → Data Model Object → Calculated Insight
Since our files are raw, they'll be listed under Data Lake Objects.
When selecting a file, you can pick which columns you want to bring in. You can now upload multiple files, so I’ll bring in the remaining three in one go.
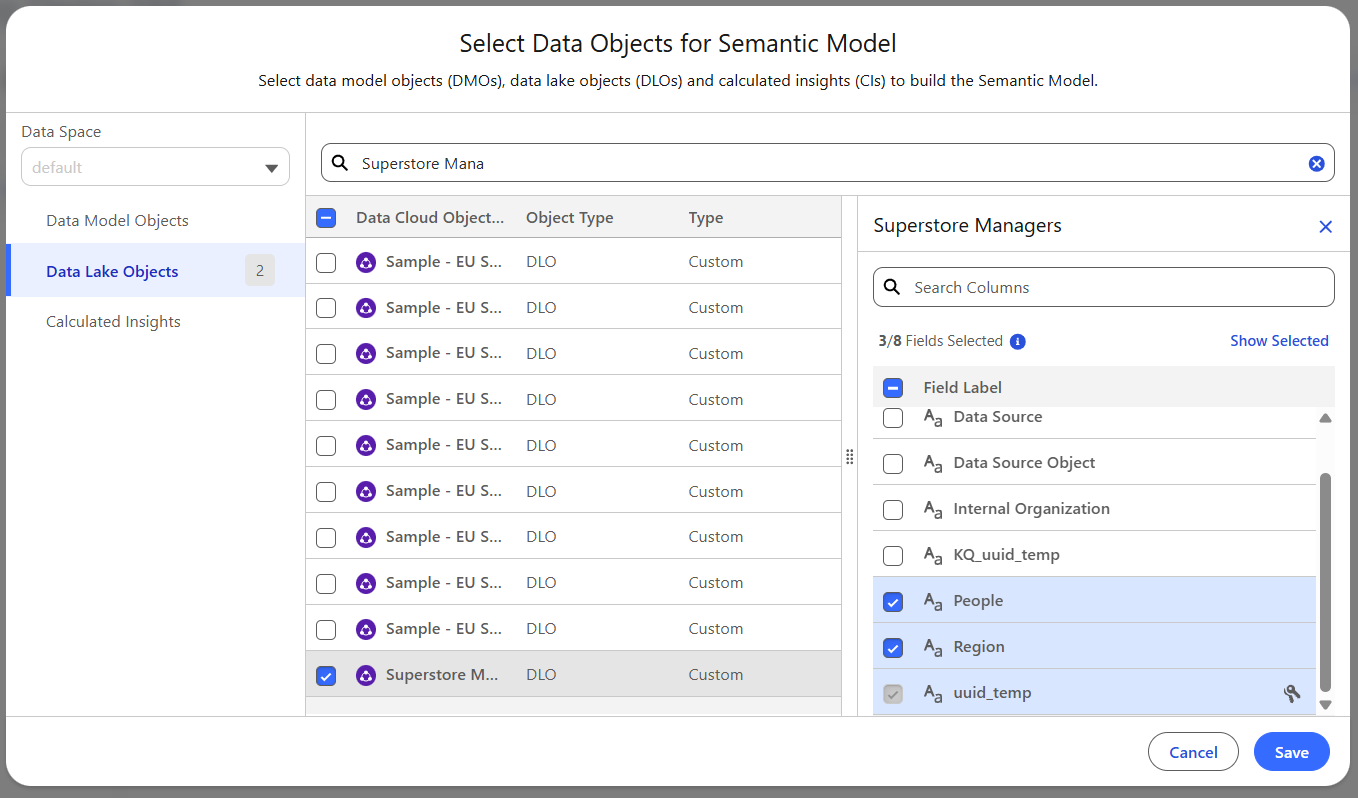
You may notice some system-generated columns (like cdp_sys_Sourceversion, Data Source, Internal Organisation, etc.). These are added by Tableau to help manage metadata. Feel free to deselect them — though note: uuid_temp is required and can't be deselected.
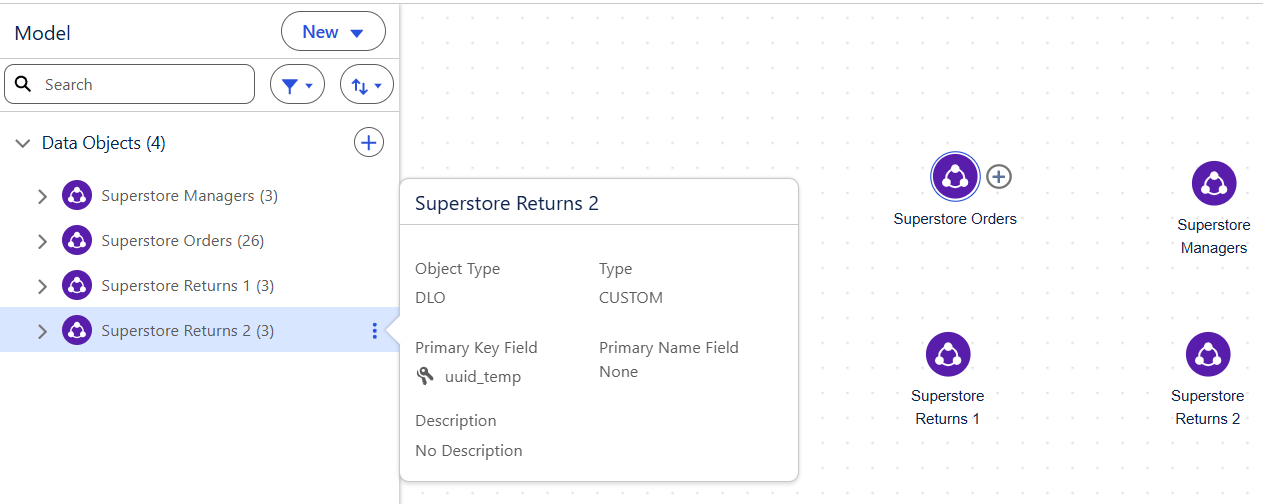
Once uploaded, the files will appear in the main modeling window and in the Data Objects pane.
Hovering over a Data Object shows details like its type, primary key fields, and description.
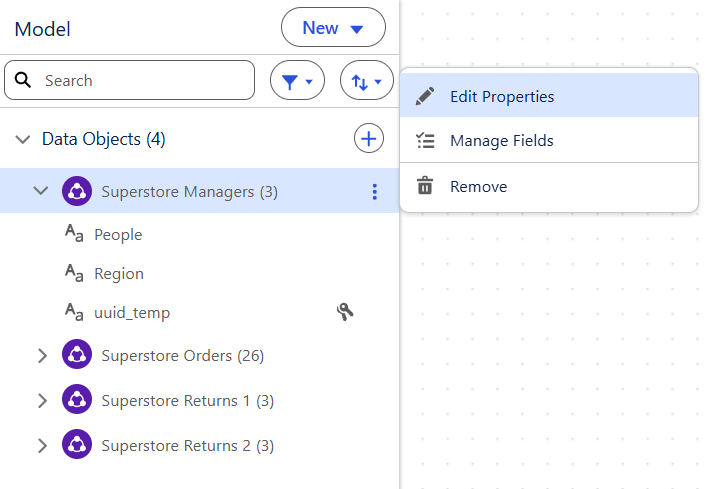
Clicking a Data Object reveals its columns. The three-dot menu gives you more options like editing properties, managing fields, or removing the object.
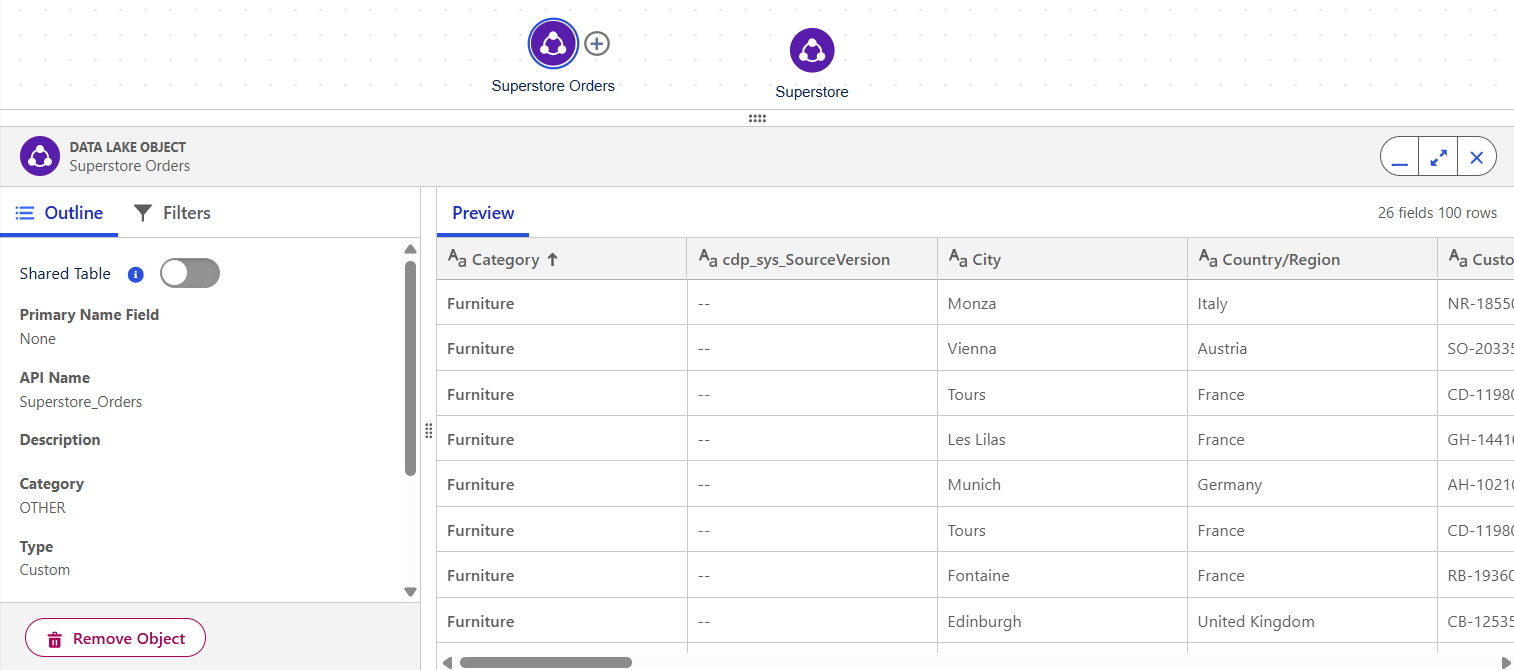
From the main modeling view, you can:
- Preview and sort the data
- Apply filters
- View object summaries
Creating Relationships between Data Objects
To create a relationship:
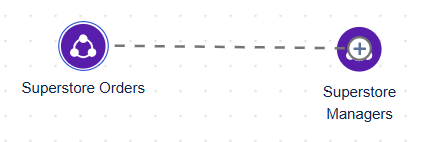
Hover over a Data Object and drag its + icon to another object.
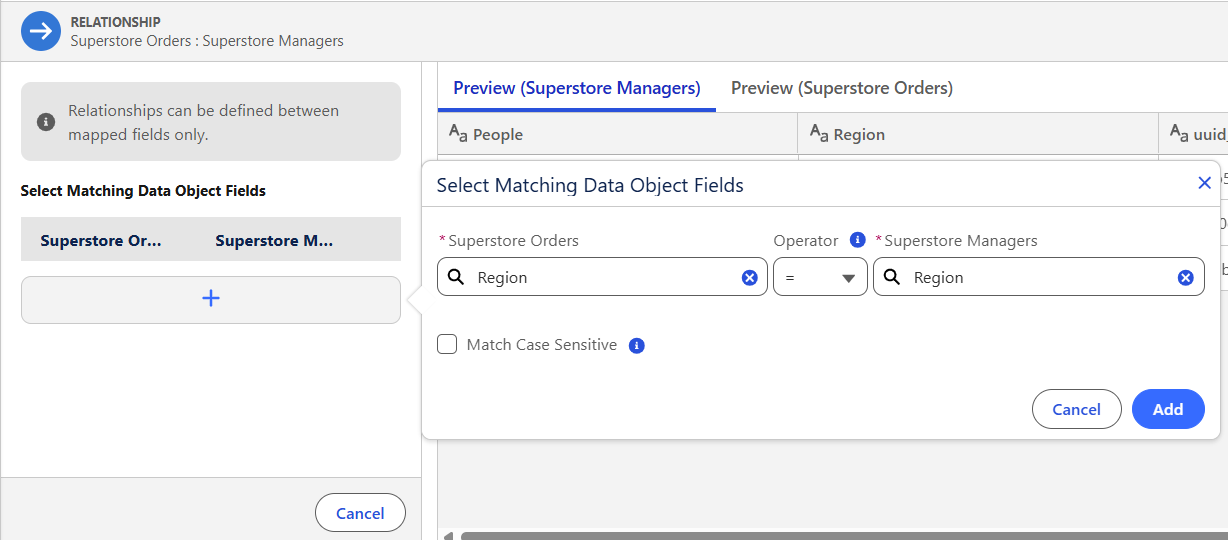
Define the relationship fields by clicking +, selecting the fields, then hitting Add.
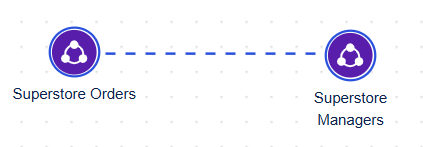
Make sure to click Apply after to confirm and create a Relationship.
Creating a Logical View
In this example, I’ve got two returns files — Returns 1 and Returns 2 — and I need to union them before relating them to the Orders table by Order ID.
This is where Logical Views come in.
Logical Views let you union or join multiple Data Objects into one single view, which can then be related to other objects.
To create one:
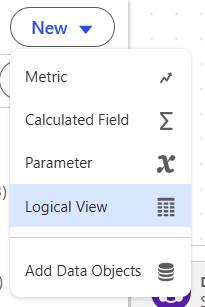
- Click New on the left pane, then select Logical View
- Give it a name and description
- Bring in one table as you can only select one at this stage — I’ll select Superstore Returns 1
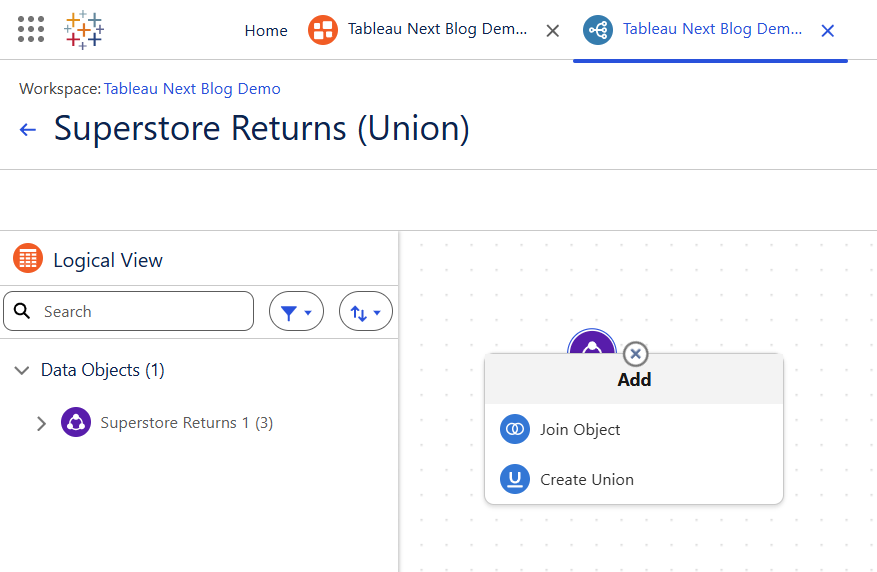
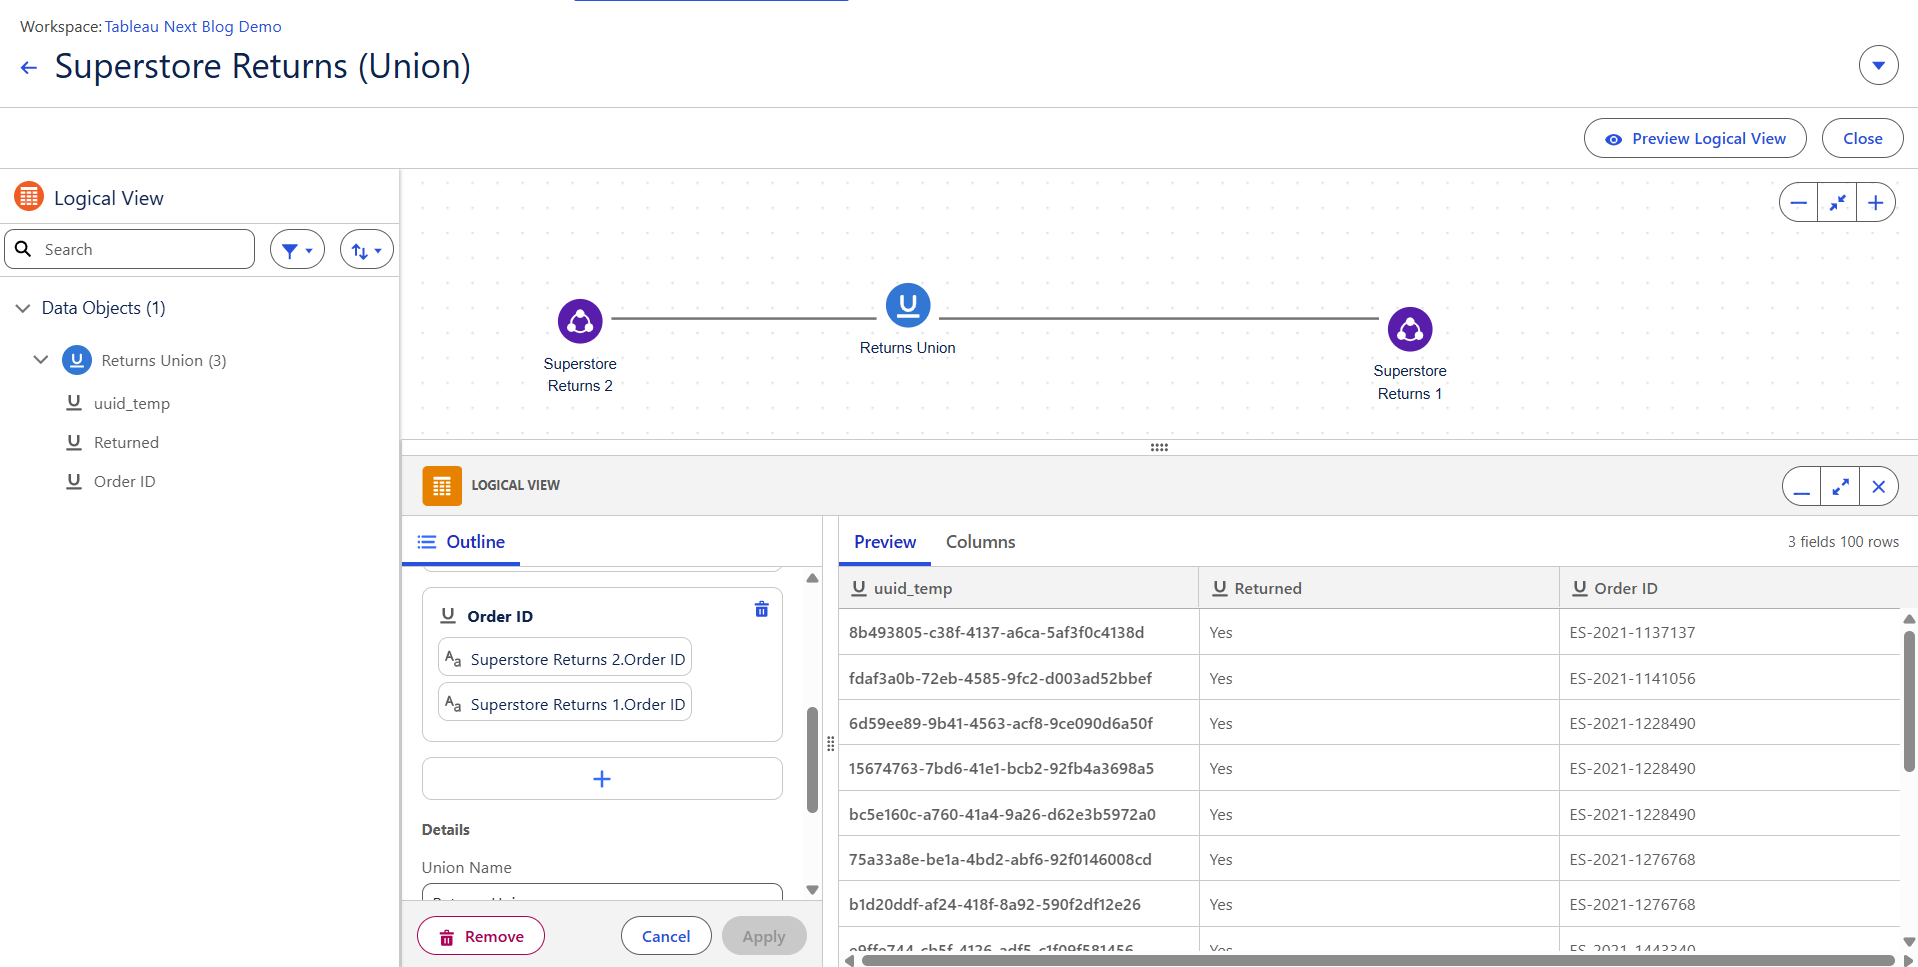
Superstore Returns 1 will then be populated in the modelling window. In our case, we’re unioning Returns 1 and Returns 2. To do this, we need to click + on the object and choose Union. Tableau will then prompt you to select the second object.
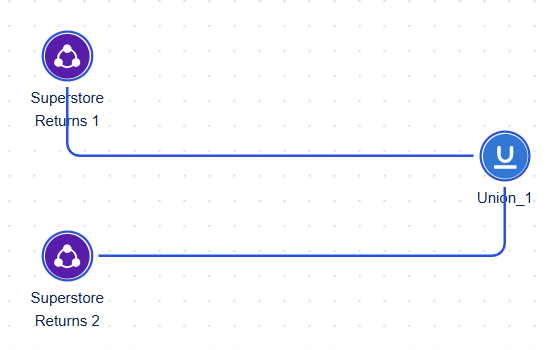
Once done, a connection like below will be made.
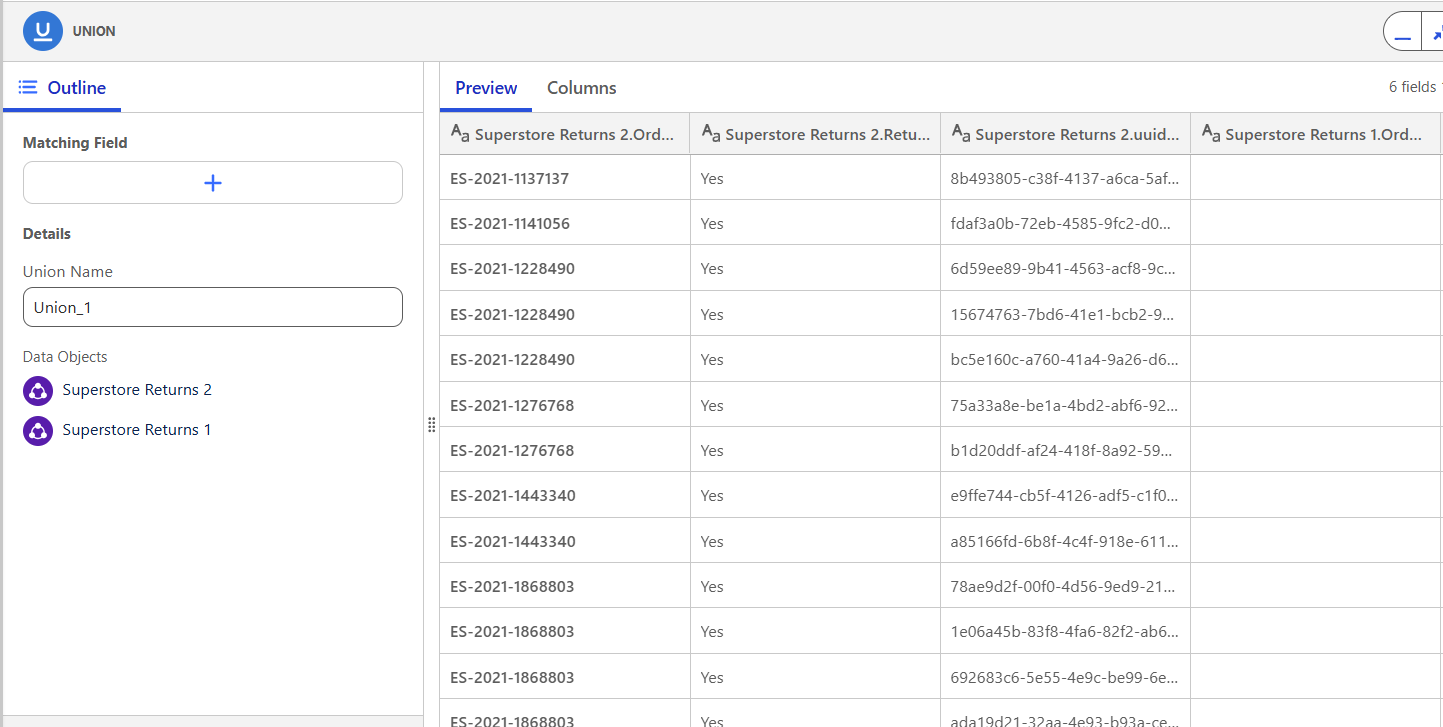
You’ll see it combine the columns, but by default it places them side by side — not quite what we want.
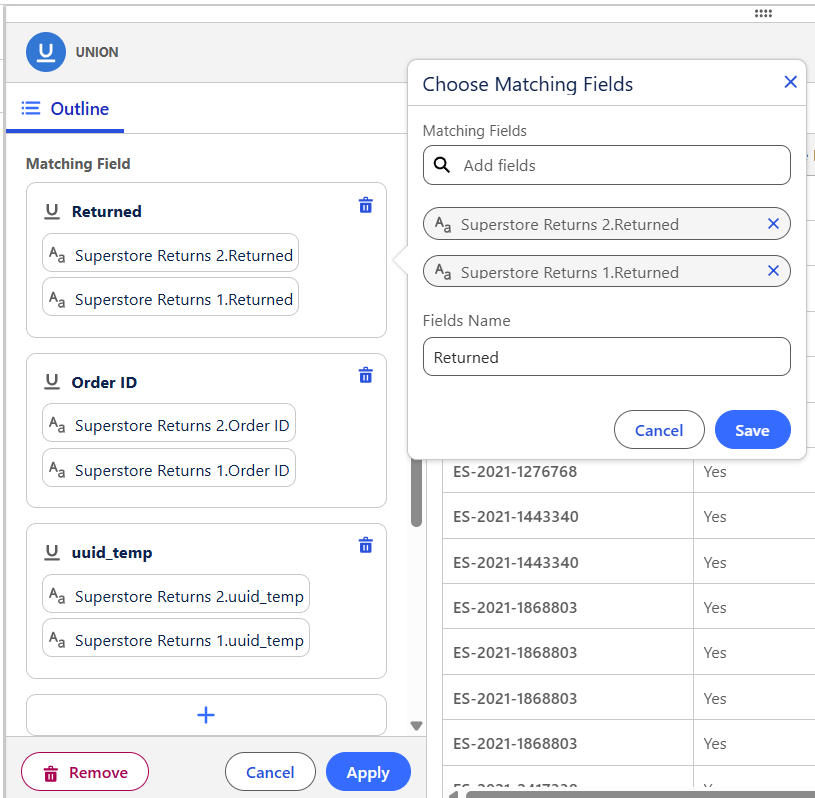
You need to define matching fields by clicking +, mapping each column (including uuid_temp), then pressing Apply.
You’ll now see the Logical View update in your Data Objects pane.
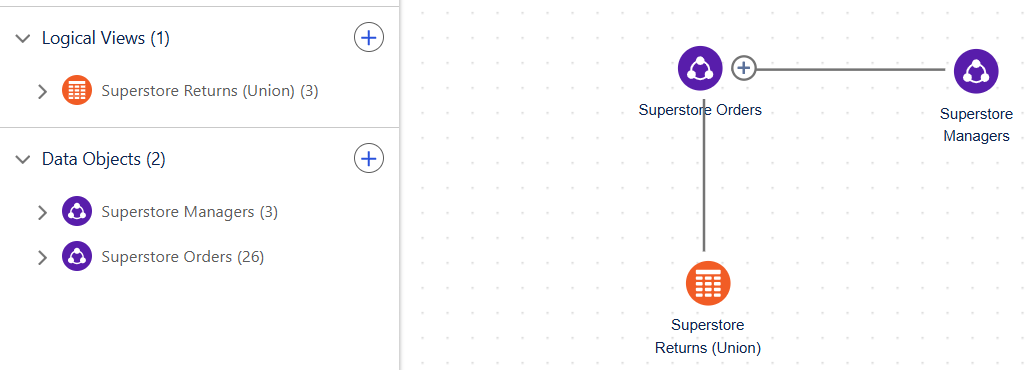
Click the back arrow next to the Logical View name (top left) to return to your main Semantic Model view.
Since the Returns tables are now combined, I’ll delete the original Returns 1 and 2 objects and relate this new Logical View to Superstore Orders using Order ID.
Creating a Calculated Field
To create a new calculated field:
- Click New > Calculated Field
- A new window opens. On the left, you’ll see all your objects and fields, plus a Functions tab for all available formulas
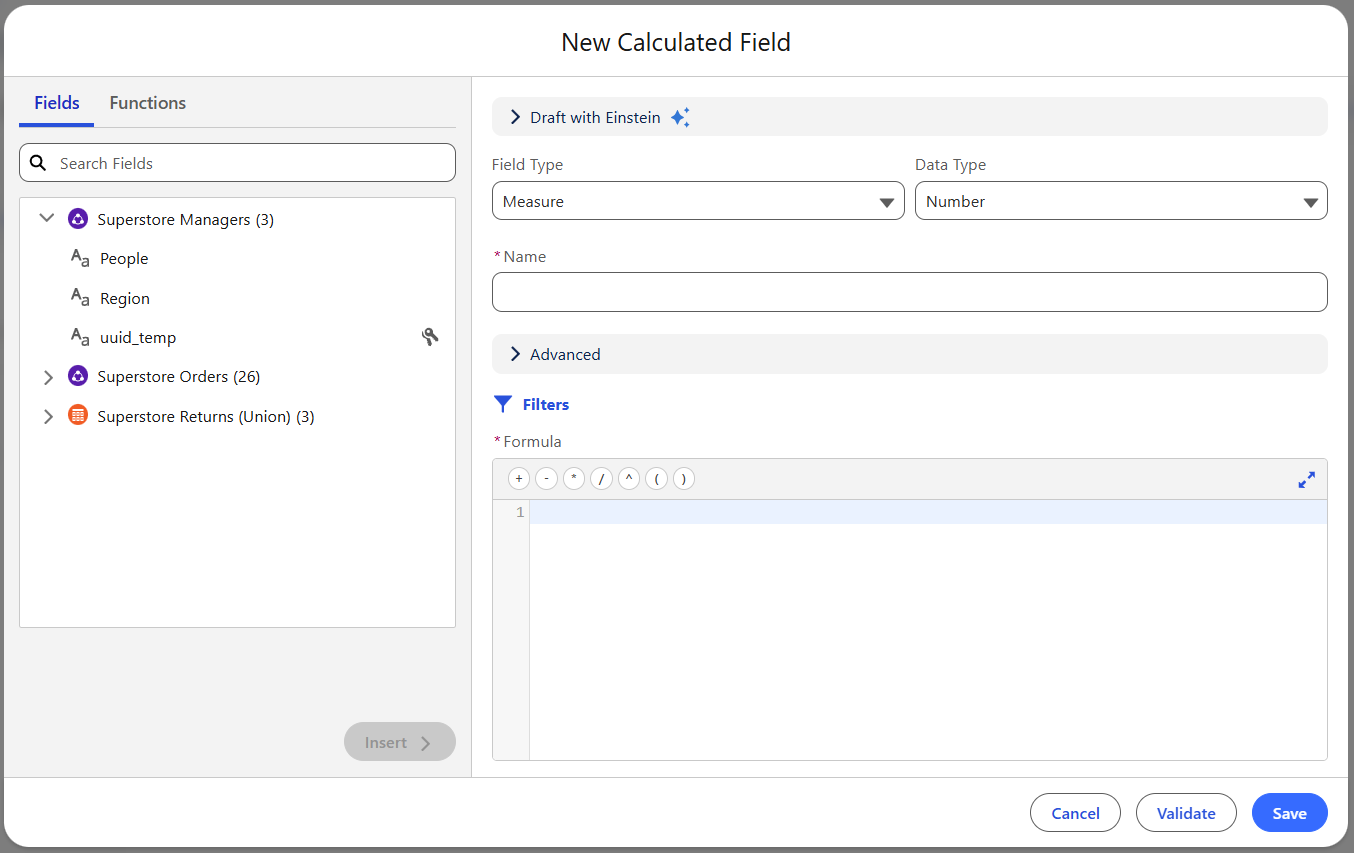
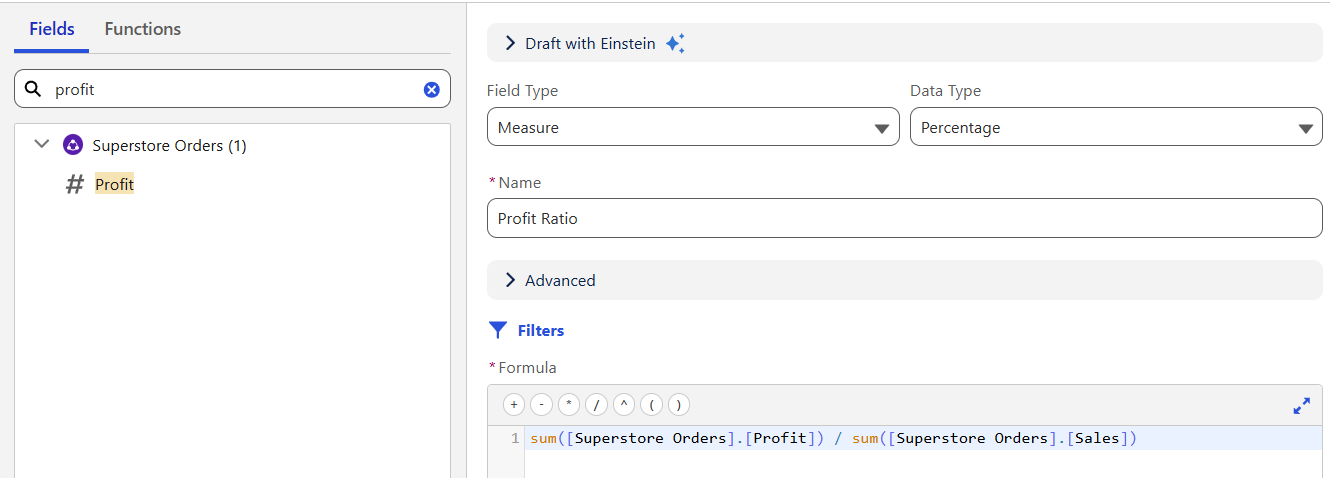
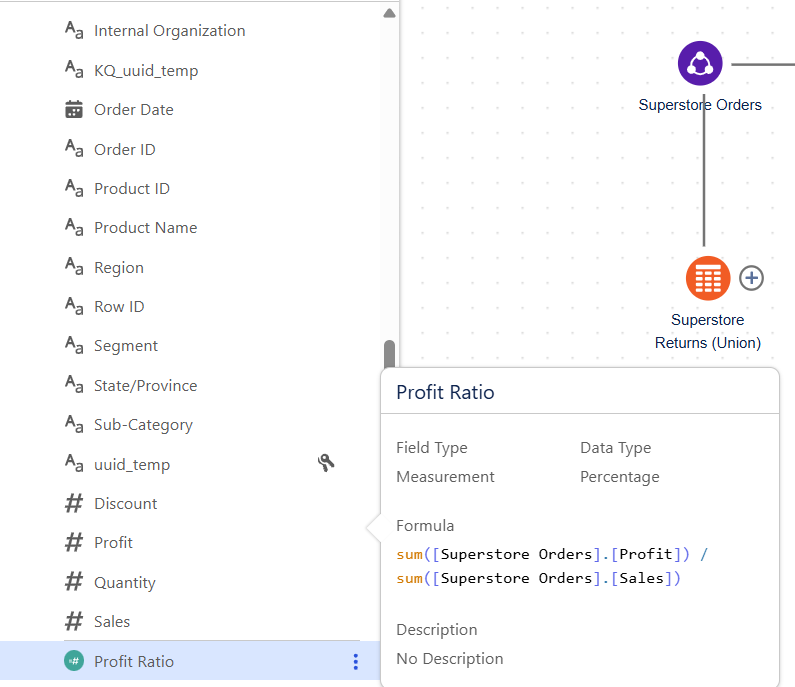
Let’s calculate a Profit Ratio as SUM(Profit) / SUM(Sales).
- Field Type: Measure
- Data Type: Percentage
- Field Name: Profit Ratio
- Formula:
- You can type directly or search for fields and click Insert to add them to your formula.
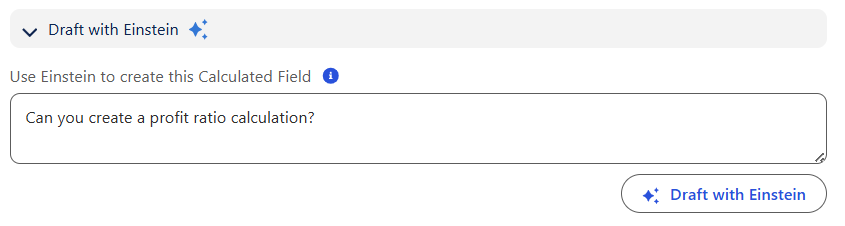
If you're unfamiliar with calculations, you can use Einstein, Tableau’s natural language assistant, to help write it for you.
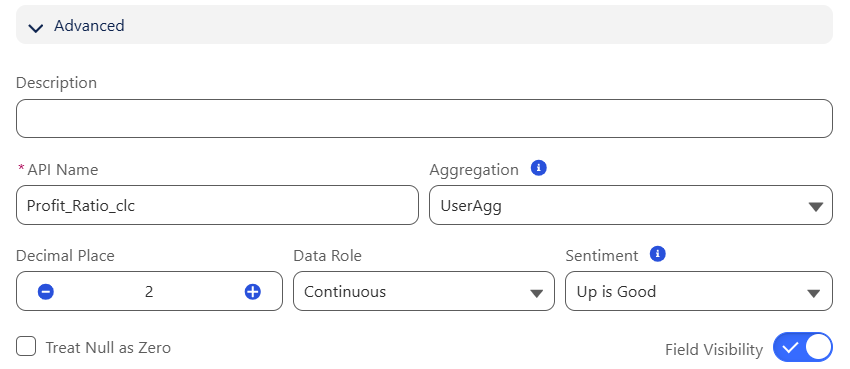
When saving, you might get an error about aggregation. Unlike classic Tableau, Tableau Next doesn't automatically assume aggregation types — you’ll need to expand the Advanced section and set Aggregation Type to UserAgg. You can also define default formatting here: number format, decimal places, data role, sentiment, etc.
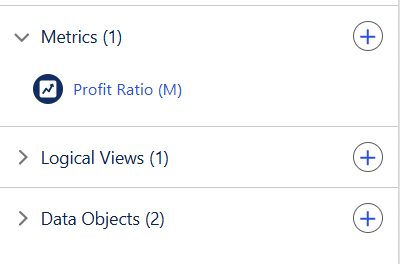
Once saved, your new field will show up in the Data Object with a green icon.
Creating a Metric
A metric in Tableau Next is defined by having a measurable field (like Profit or Sales) against a time period (like Date). You need these two to be able to create a metric.
To create a new metric:
- Click New > Metric
- Add a name and description under Details
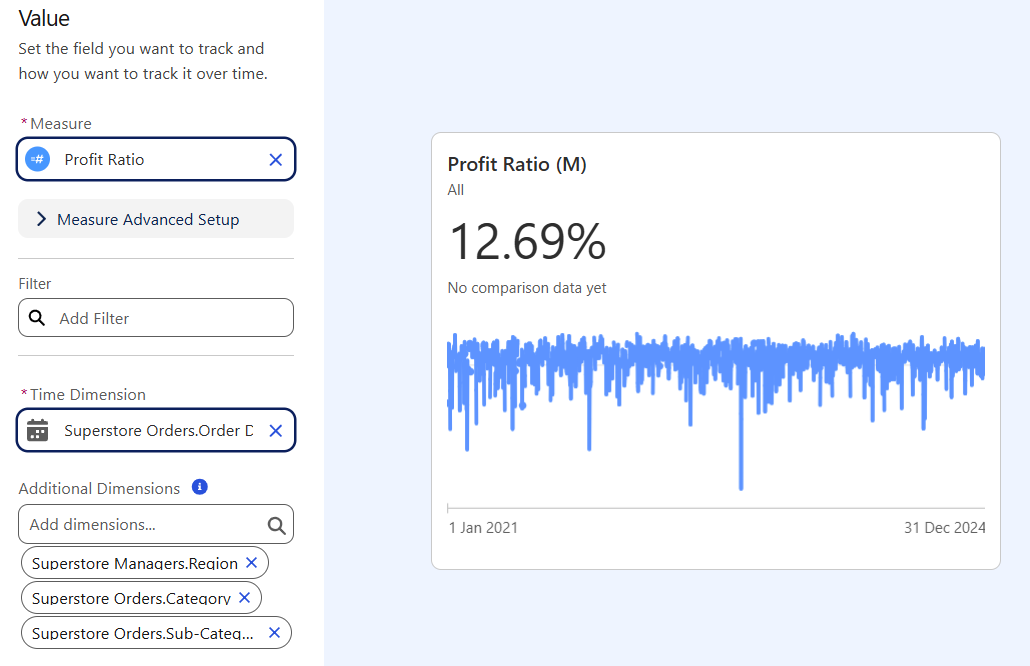
- Under Value, choose:
- A Measure (e.g., Sales or Profit)
- A Date field
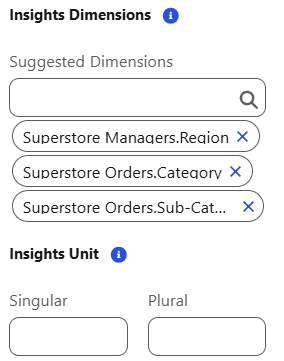
- Any filters or additional dimensions
A key step here is Additional Dimensions — adding fields like Region or Category allows your metric to respond to dashboard filters and power deeper insights.
For example, if you include Region and Category here, your dashboard can break down the KPI by these fields. If you skip this, applying filters like Country later won't work — your metric will break or show nothing.
Under Insights, you can toggle features like trend detection or top contributors. I recommend leaving them on.
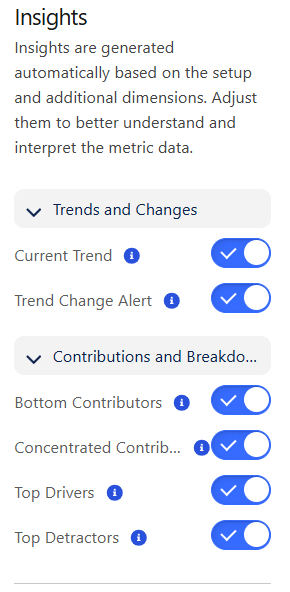
You can also define singular and plural units.
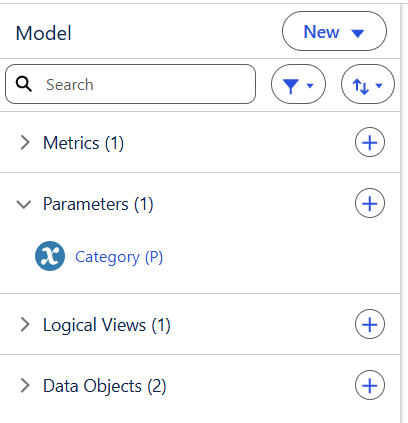
Once done, click Save. Your metric will now appear under the Metrics tab.
Creating a Parameter
To add a parameter:
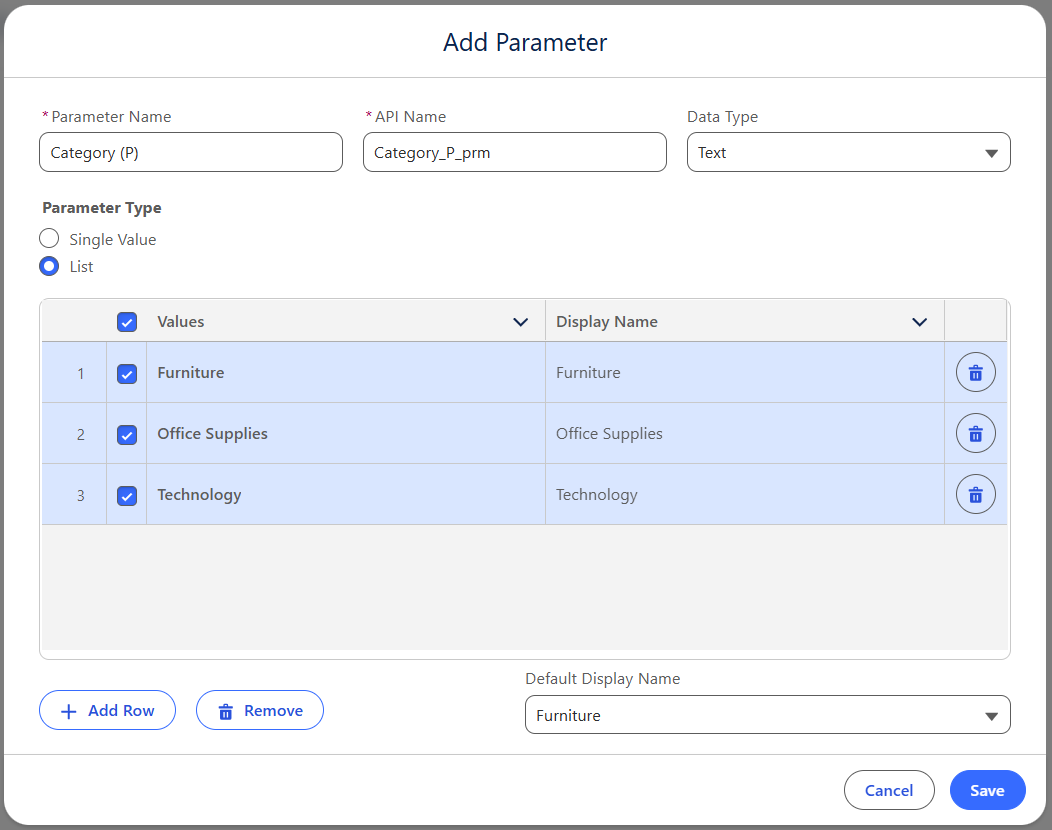
- Click New > Parameter
- Set the type: single value or list
- Define Value and Display Name
- Set a default value
Unlike Tableau Desktop, you currently can't pull in values from a field. So if you want a dropdown with 50 countries, you'll need to enter them manually (for now).
Once saved, your parameter will appear in the relevant pane.
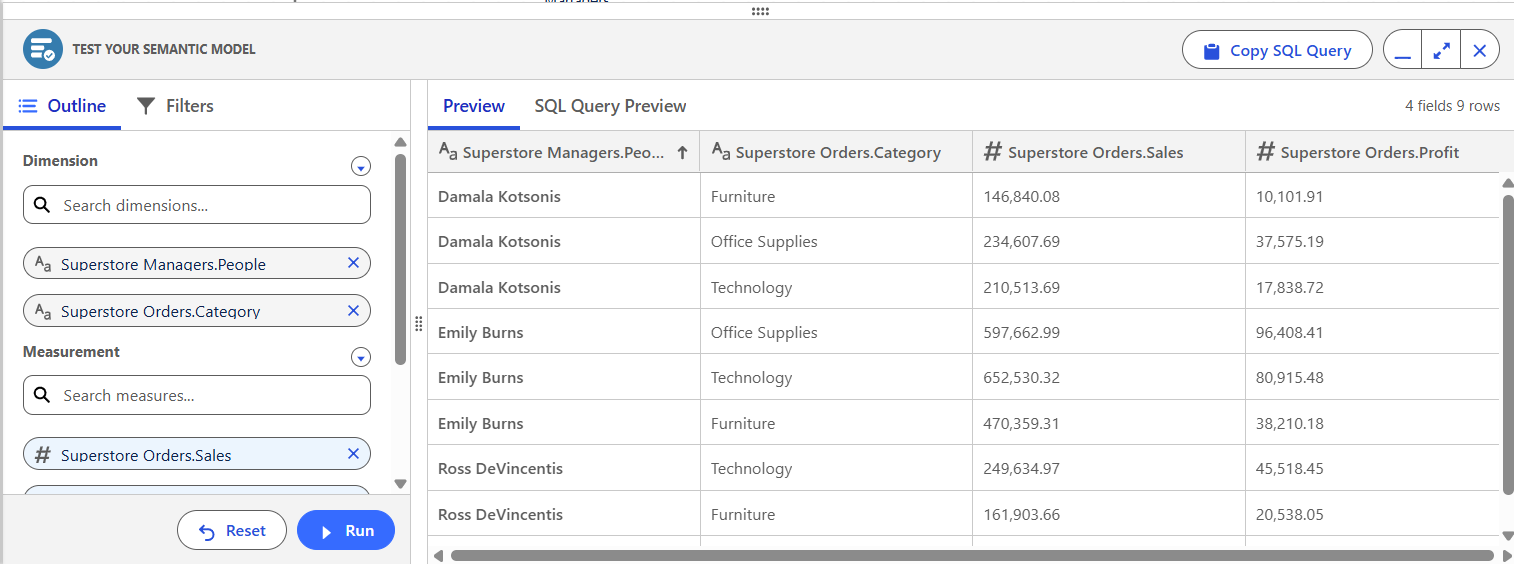
Test Your Model
Once you’ve built your objects, metrics, parameters, and relationships, click Test Model (top right). Pull in a few fields to see how your data behaves — this gives you a feel for how your model will perform in visualisations.
You Did It!
And that’s it — you’ve officially built a Semantic Model in Tableau Next. You now have a structured, analysable model ready for visualisation.
Next up in Part 3: We’ll dive into building your first set of visualisations.