


The Data
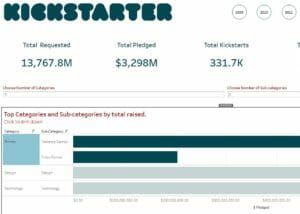
The data was pretty tidy so I just added some columns for the duration of the campaign and the number of pledges / duration. I was focusing on comparing the categories and sub catogories for quite some time when I realised that with the amount of inflation over ten years, it made no sense to compare the performance statically.
With very little time to spare, I started from scratch and compared the performance across time, with some set actions to drill down between categories.
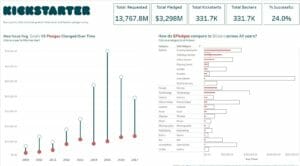
I learned some useful ways to use ranks to filter by a few top performers within a category.
Take away lesson, really understand the data before you make a plan.