It was the ‘Don’t Use Tableau’ day of dashboard week.
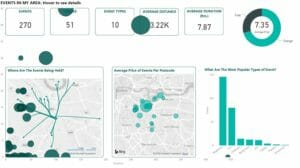
We took data from the Skiddle API about events within a certain radius. I used Power BI for my dashboard. I had been looking at these Viz types and wanted to use some sort of Map/flow chart to filter and compare different venues and events near to my home.
By the time I had figured out the basics of BI, the flow chart took a bit more of a back seat and I left it up to the automatic filters and tooltips to navigate the viz. Taking advantage of BI’s more organised floating charts, I’m unapologetic for the layering of the vizzes on top of eachother as the viz underneath is not interactive- and this is an upside-down day anyway.