


(Tableau 2023.1+ • Sample – Superstore)
Learn how to build a Dynamic Zone Visibility drill-down in Tableau that lets users Ctrl-click multiple states, instantly reveal a city-level map, and click once to swap back to the U.S. overview—no sheet tabs, only a Boolean parameter and two change-parameter actions required.
Create Parameters and Calcs for DZV
- Create Parameter
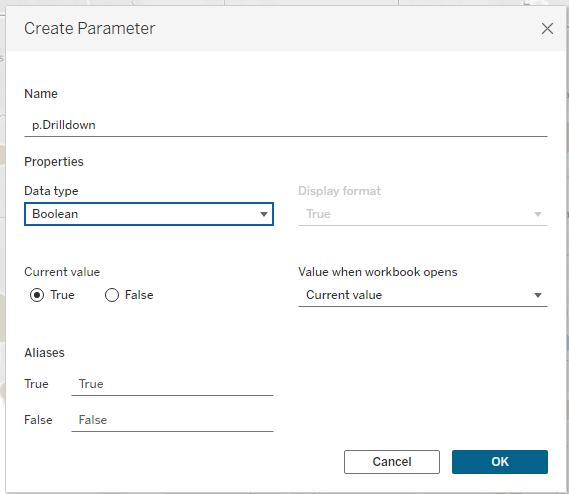
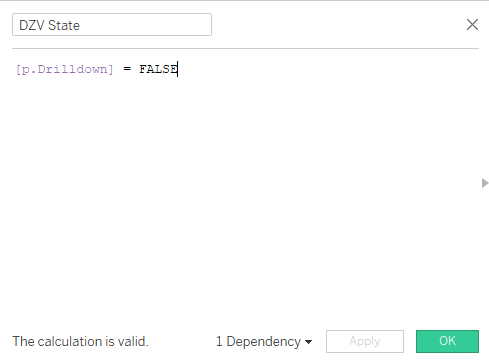
- DZV Calc to Show State Map
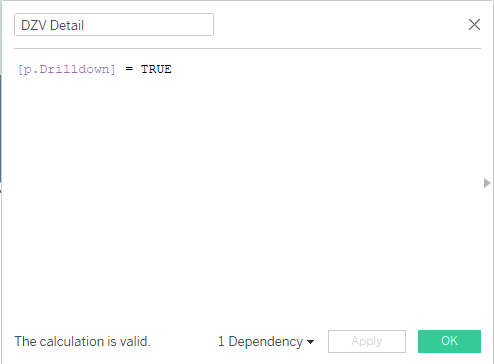
- DZV Calc to Show City Map
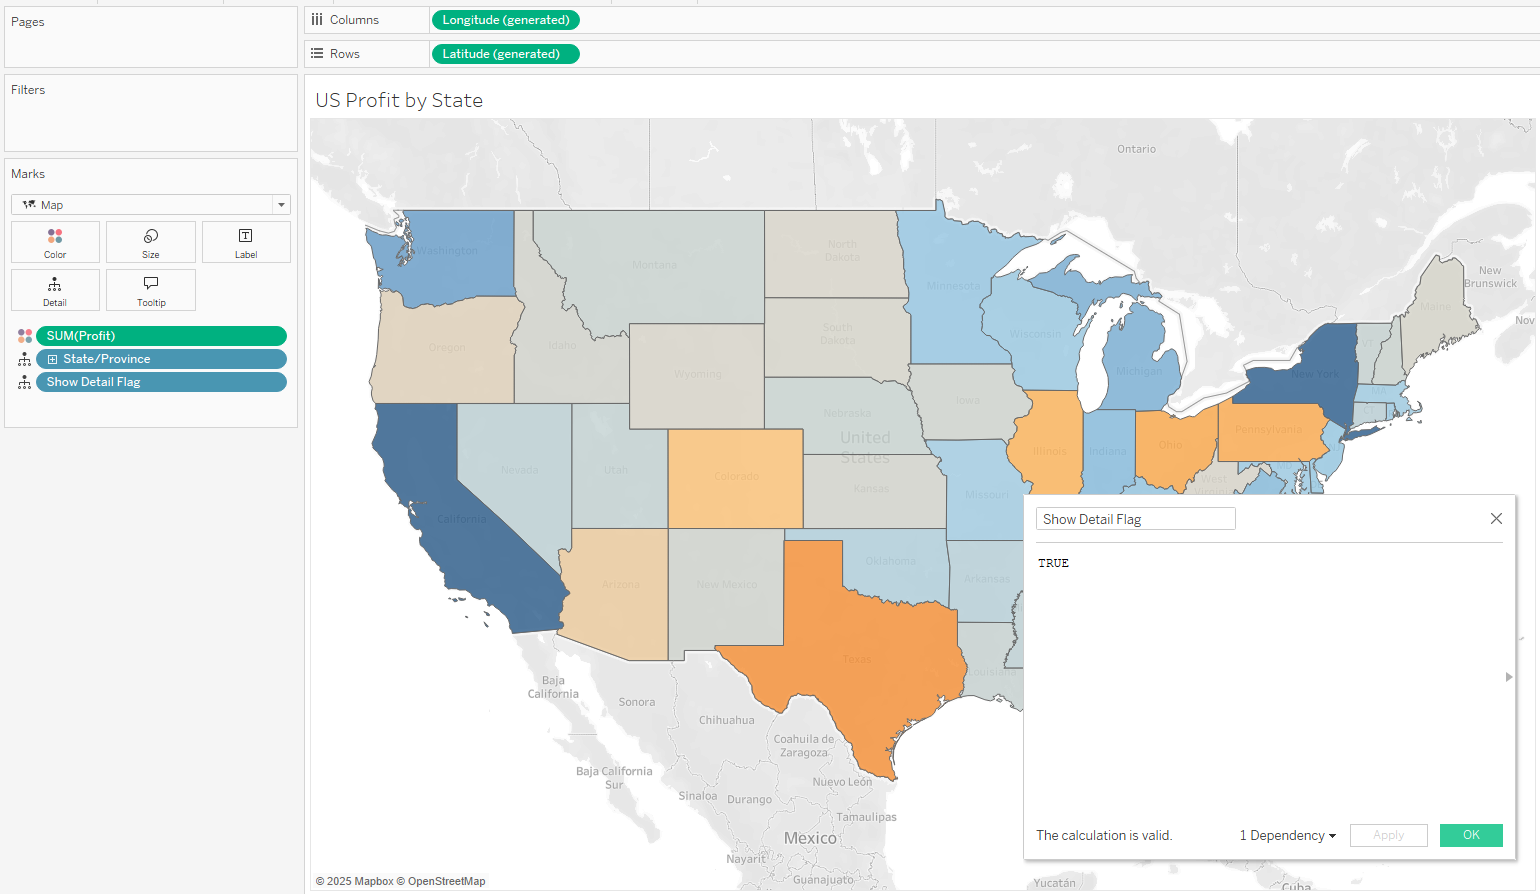
Sheet 1 – “US Profit by State” (unchanged)
Longitude (generated)→ ColumnsLatitude (generated)→ Rows → mark type MapState→ Detail |Profit(SUM) → Color (diverging centred 0)Calc: Show Detail Flag(TRUE) → Detail
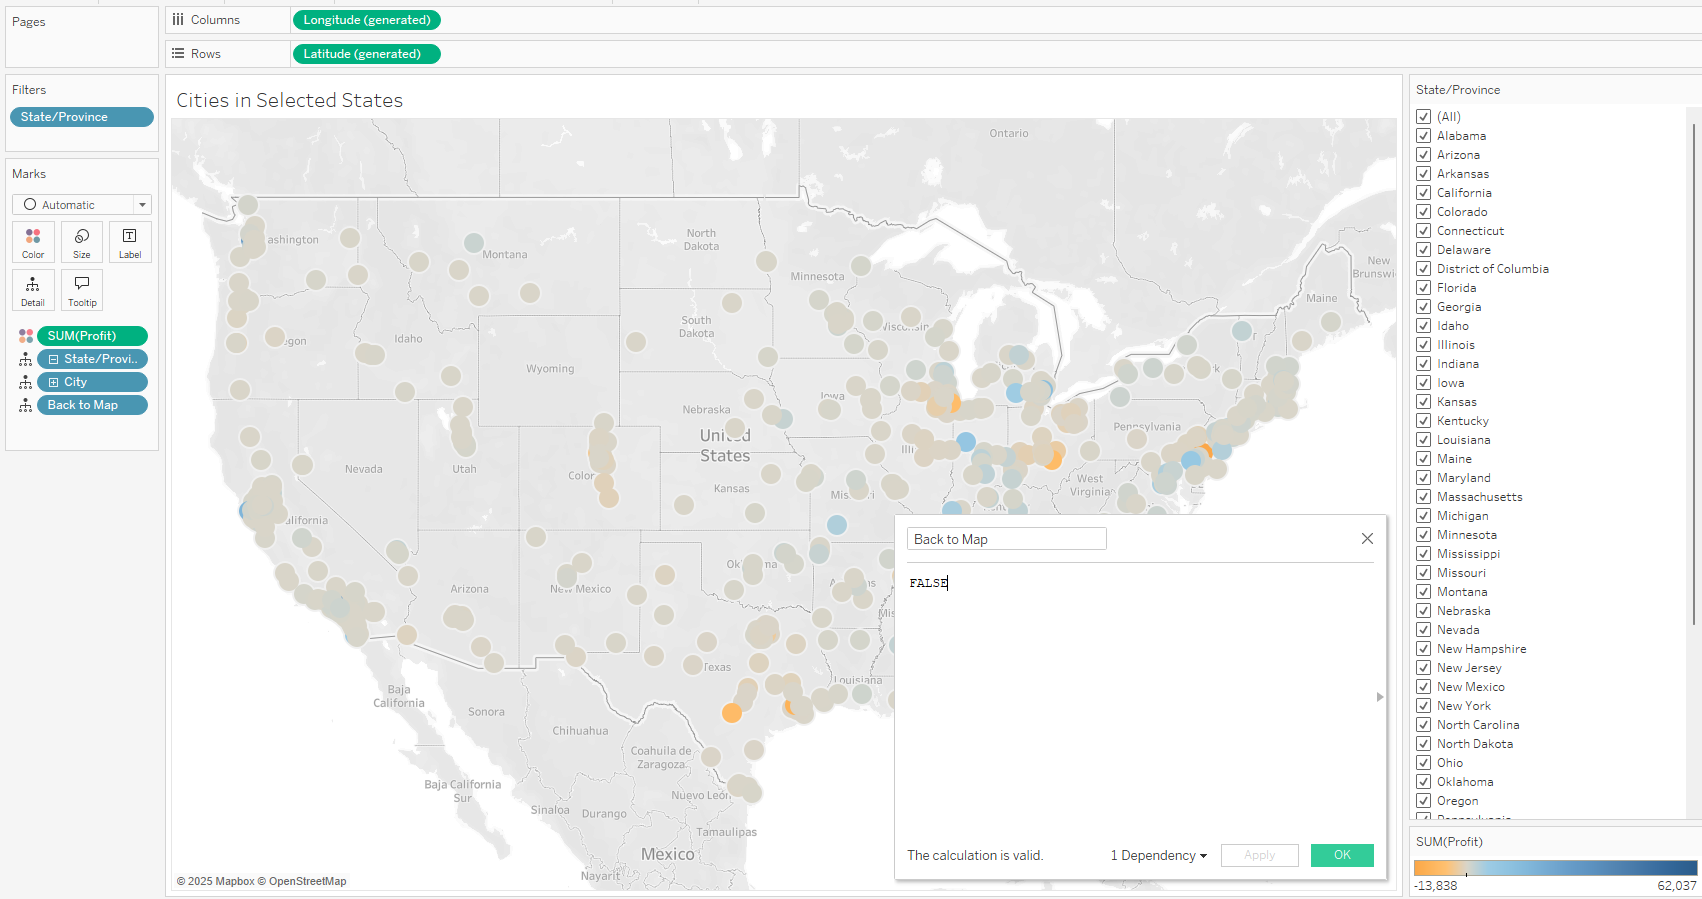
Sheet 2 – “Cities in Selected States”
Longitude (generated)→ ColumnsLatitude (generated)→ Rows → mark type CircleCity→ Detail |State→ DetailProfit(SUM) → Color (synchronise palette with Sheet 1)State→ Filters (keep All – listens to the action)Calc: Back to Map(FALSE) → Detail
Dashboard Steps
- Drop both sheets into one Vertical container.
- Dynamic Zone Visibility
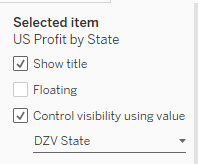
- Control State Map Visibility Using DZV State
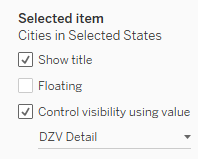
- Control City Map Visibility Using DZV Detail
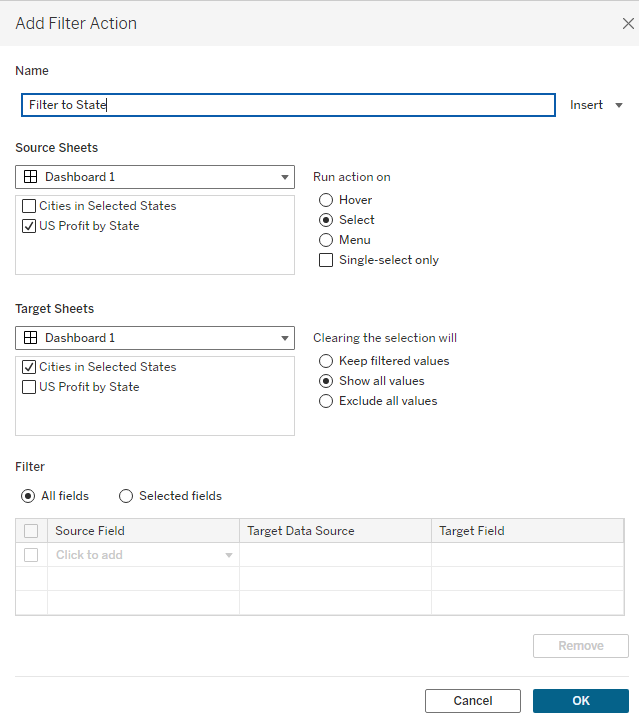
- Filter Action: State-map → City-map (field = State, Run = Select, Clearing = Show all values).
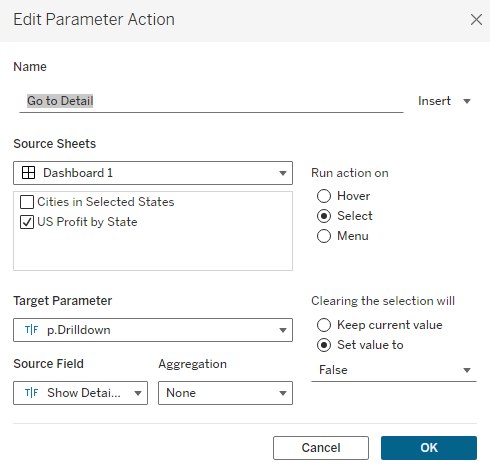
- Change-Parameter - Go to Detail:
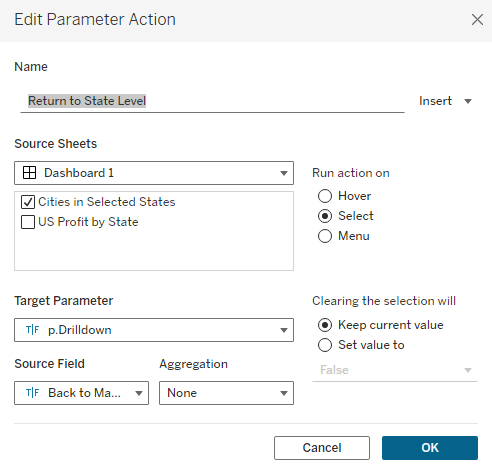
- Change-Parameter - Return to State Level:
Using It
- Ctrl-click or lasso multiple states → DZV flips to a city-level map filtered to those states.
- Click any city on the city map → instantly back to the U.S. view.