Clustering uncovers natural groupings in your data. Tableau already excels at visual exploration, but adding a Python model through TabPy lets you:
- tap into scikit‑learn’s battle‑tested algorithms
- tweak model parameters (like the number of clusters, k) in real time
- keep everything inside the familiar Tableau canvas
For help installing TabPy check out these excellent resources from my colleague Le Luu
1 Set up the playground
| Step | What to do |
|---|---|
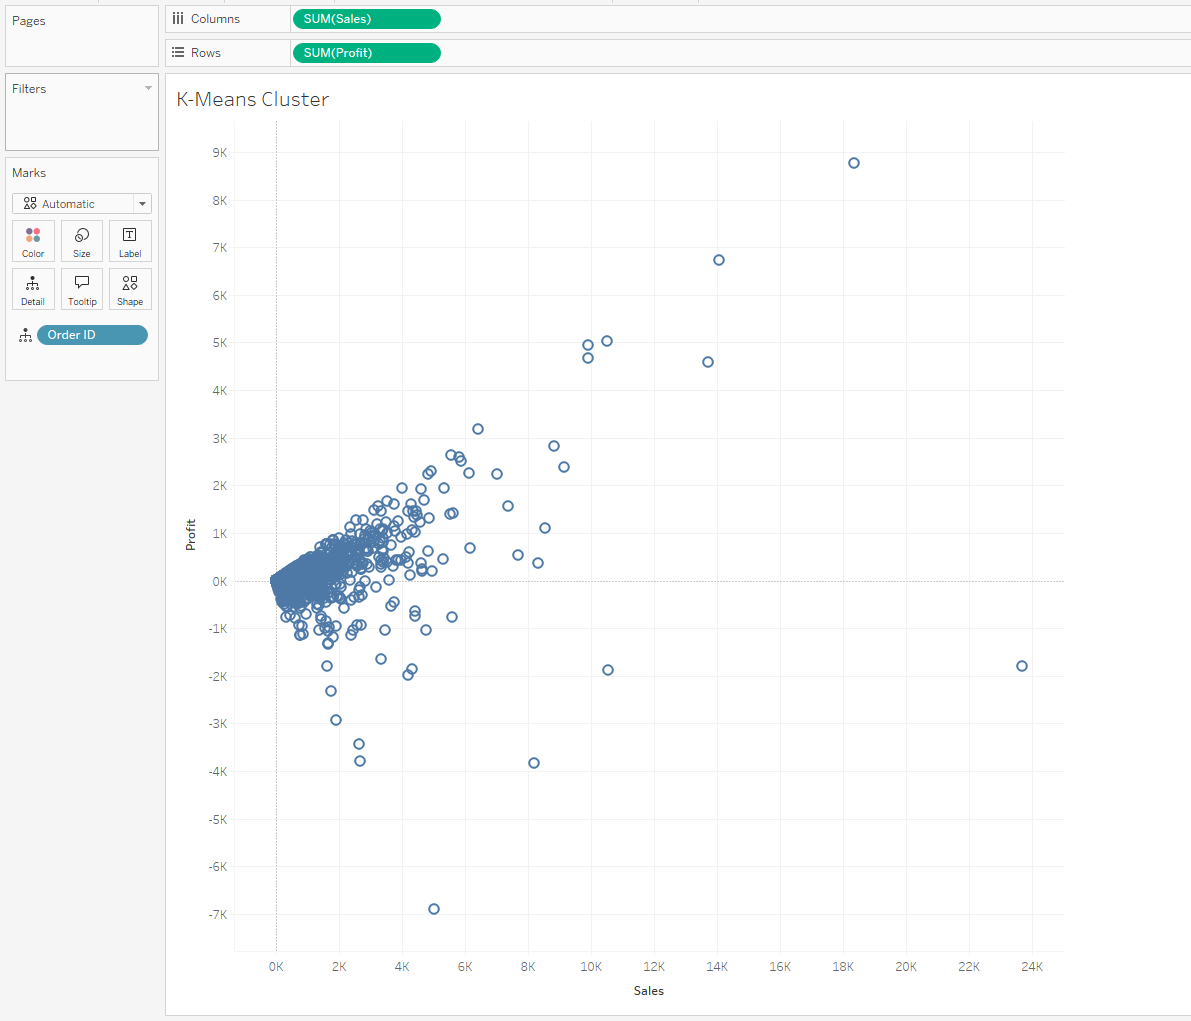
| Data | Open the built‑in Sample – Superstore data source. |
| Viz canvas | Create a new worksheet. Drag SUM(Sales) to Columns and SUM(Profit) to Rows—classic profitability scatter‑plot. |
| Grain | Drag Order ID to the Detail shelf so each dot represents a single order. |
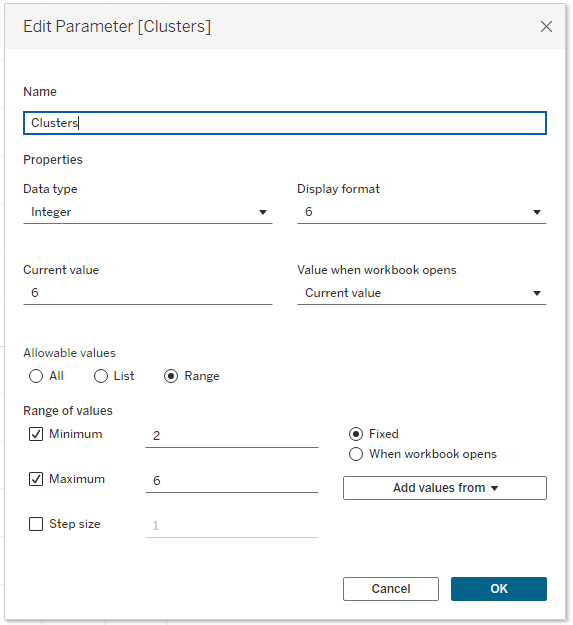
2 Create a user‑controlled parameter
- Right‑click in the Data pane → Create → Parameter…
- Name it Clusters (K)
- Data type: Integer
- Allowable values: Range (Min = 2, Max = 6, Step = 1)
- Click OK and Show Parameter so users get the slider.
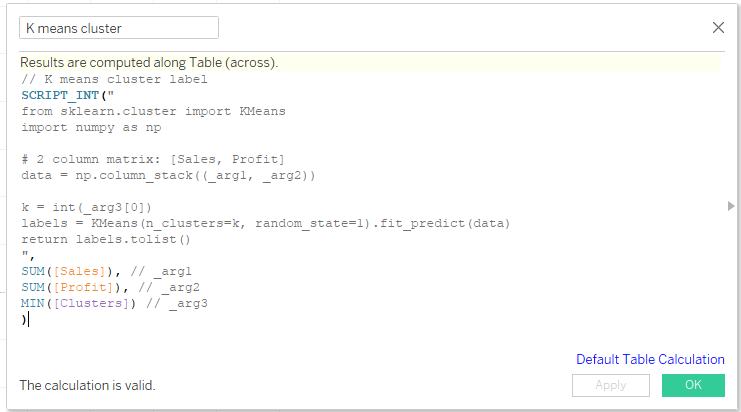
3 Write the TabPy calculation
Create a calculated field called K‑means cluster and paste:
tableauCopyEdit// Assign an order‑level cluster label based on Sales & Profit
SCRIPT_INT(
"
from sklearn.cluster import KMeans
import numpy as np
# 2‑column matrix: [Sales, Profit]
data = np.column_stack((_arg1, _arg2))
k = int(_arg3[0]) # user‑selected k
labels = KMeans(n_clusters=k, random_state=1).fit_predict(data)
return labels.tolist() # Tableau needs a plain list
",
SUM([Sales]), // _arg1
SUM([Profit]), // _arg2
MIN([Clusters (K)]) // _arg3
)
Why MIN()? Tableau requires every argument in a table calculation to be aggregated.
Scalars like parameters arrive as a one‑value list; taking the min (or max) just extracts that value.
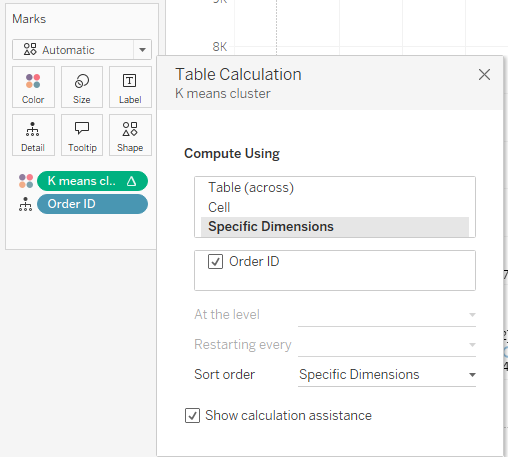
4 Tell Tableau to send all rows in one batch
- Drag K‑means cluster onto the Color shelf.
- Right‑click it → Edit Table Calculation…
- Choose Specific Dimensions and tick Order ID only.
This makes Tableau address over every order while keeping the entire dataset in a single partition—perfect for fitting one model.
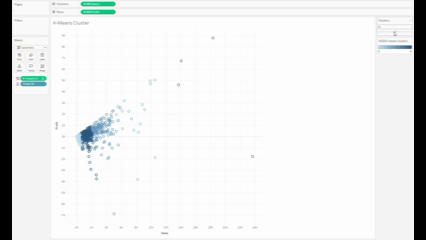
5 Interact and explore
Move the Clusters (K) slider:
- Tableau re‑sends the Sales‑Profit matrix to TabPy
- scikit‑learn refits K‑means with the new k
- cluster labels stream back and your scatter‑plot recolous instantly
Try 2 ≤ k ≤ 6 to see how groupings tighten or split. Hover on a dot to inspect an order’s cluster membership.