


When working in Tableau, green and blue pills are dragged on to the shelves or marks cards to create a visualization. Understanding the meaning of these pills is important when creating visualizations.
Dimensions vs. Measures
Dimensions contain qualitative or categorical data (names, IDs, geographical locations, dates). They create headers (text names associated with the data), and cannot be aggregated. Since measures are numbers, they are automatically aggregated.
Discrete vs. Continuous
When determining if data is discrete or continuous, it is important to think about if values can be counted, measured or broken into smaller parts. If a value can be broken into smaller parts, it is likely discrete. Examples of discrete values are employees, customers and products.
Continuous values cannot be broken down into smaller individual parts. Examples of continuous data would include height, weight, and temperature. These values are typically measured over a continuous time period.
When Blue Meets Green
Discrete dimensions and continuous measures are most commonly used when creating visualizations in Tableau. But can a dimension become measurable? Or can a measure become discrete?
Discrete Dimension
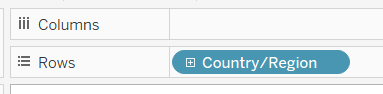
Discrete dimensions cannot be aggregated. Given their static nature, they are often presented as a discrete element, which is represented as blue in Tableau.
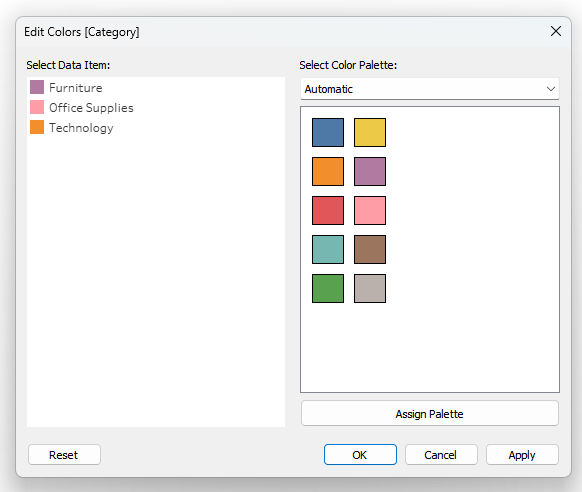
If a discrete dimension is dragged onto "Color" on the Marks Card, each dimension is represented by a separate color.
Continuous Measure
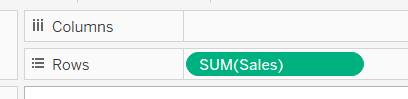
Continuous measures are represented as green in tableau, and can be calculated or aggregated over a continuous period.
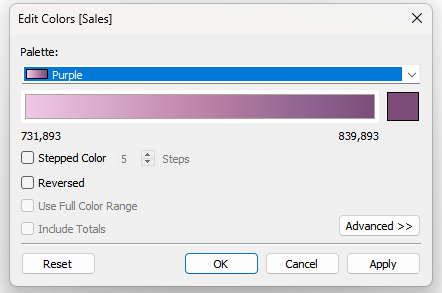
If a continuous measure is dragged onto "Color" on the Marks Card, the measure would be represented by a continuous color gradient.
Continuous Dimension
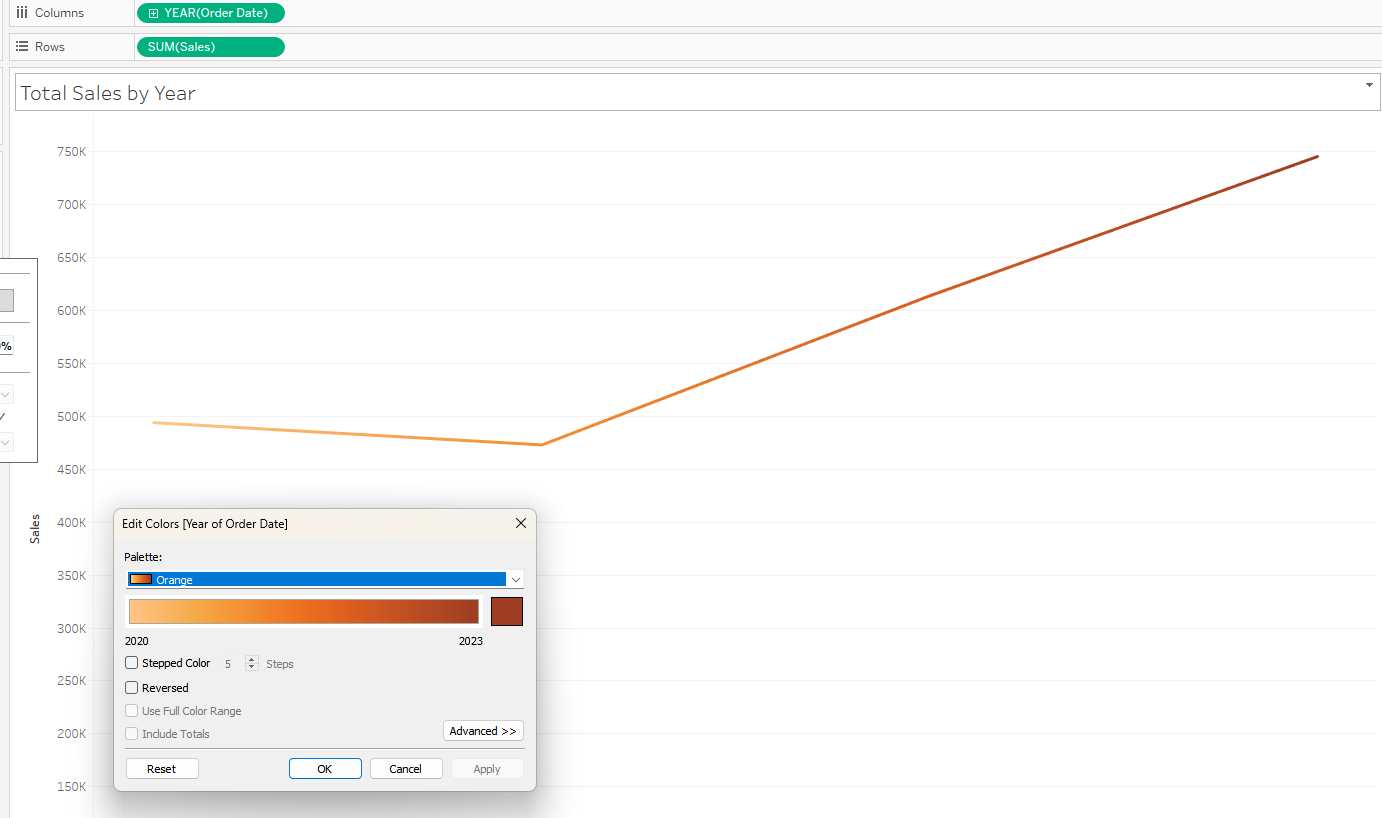
Continuous dimensions are useful when displaying dimensions across a continuum. Though dates are typically discrete dimensions, when changed to a continuous dimension, they can be viewed across a period of time.

When a continuous dimension is dragged onto "Color" on the Marks Card, the value would be represented by a continuous color gradient.
Discrete Measure
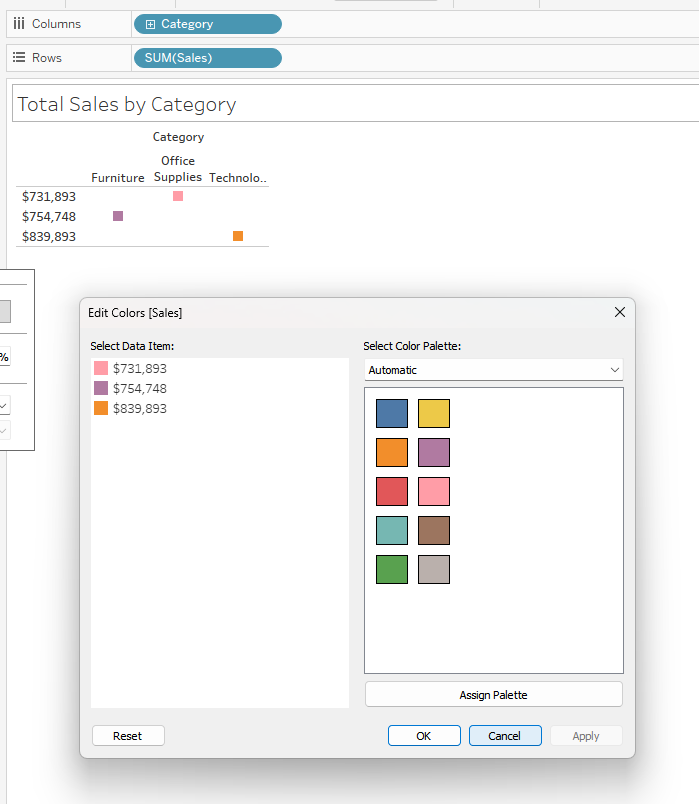
A discrete measure is a categorical value that was previously aggregated, and therefore can be presented categorically.
When a discrete measure is dragged onto "Color" on to the Marks Card, the measure would be represented by a categorical color palate.
Final Thoughts
Understanding these concepts is the ultimate indicator that someone has become proficient with Tableau. By understanding these foundational concepts, it will be easier to troubleshoot when issues arise.