Day 3 of dashboard week, and today we were told to make a Tableau dashboard using data from UK police forces. We had to connect to a series of APIs in order to obtain the data, which we did using Alteryx.
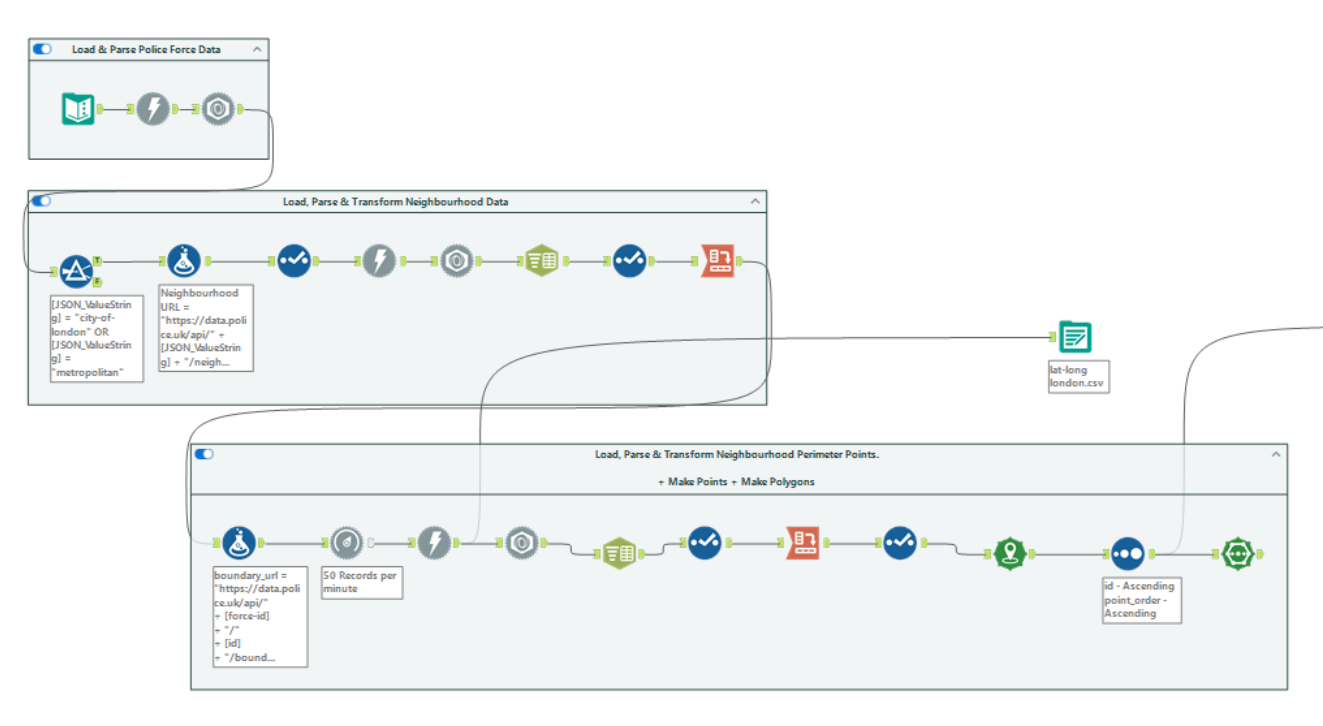
I started by planning the Alteryx flow. I effectively concatenated a series of API GET calls, getting data from one call and using it to obtain more data from the next. I began with the Forces API, which returns the police forces available through the data.police.uk API. From this, I filtered down to the Metropolitan Police and the City of London Police, as I wanted my dashboard to focus on London. From there, I used the Neighbourhoods API to retrieve all neighbourhood IDs and names for those forces.
Next, I fed the neighbourhood IDs into another API to get the boundaries of the neighbourhoods. We used Alteryx's spatial functions to combine the series of points that characterised the neighbourhood perimeters to generate polygons.
So much was straightforward. What we struggled with was connecting to the Street-level crimes API. In order to obtain data on the crimes that occurred within each neighbourhood, we had to pass every coordinate (latitude, longitude pair) that characterised the neighbourhood into the URL. This led the the URLs becoming too big. We tried a few workarounds, like rounding the latitude and longitudes to a fewer number of decimal places, but the URLs for some neighbourhoods were still too big.
Mr. Omnipresent himself - Rosh Khan - tried to help us out with a POST request method, but we decided against it in the interest of time. We all had to bite the bullet and manually download a flat file containing data on the crimes that happened in London.
All that was left to get the data in a workable state was to join the crime data to the polygon data using the INTERSECTS function within Tableau, which returns a TRUE if one geometry intersects another.