


As I already mentioned in my last blog post, last week was Dashboard Week.
Seeing a lot of different datasets everyday, fixing them with Alteryx and then creating vizualizations every day has been pretty intense but a very useful exercise for us!
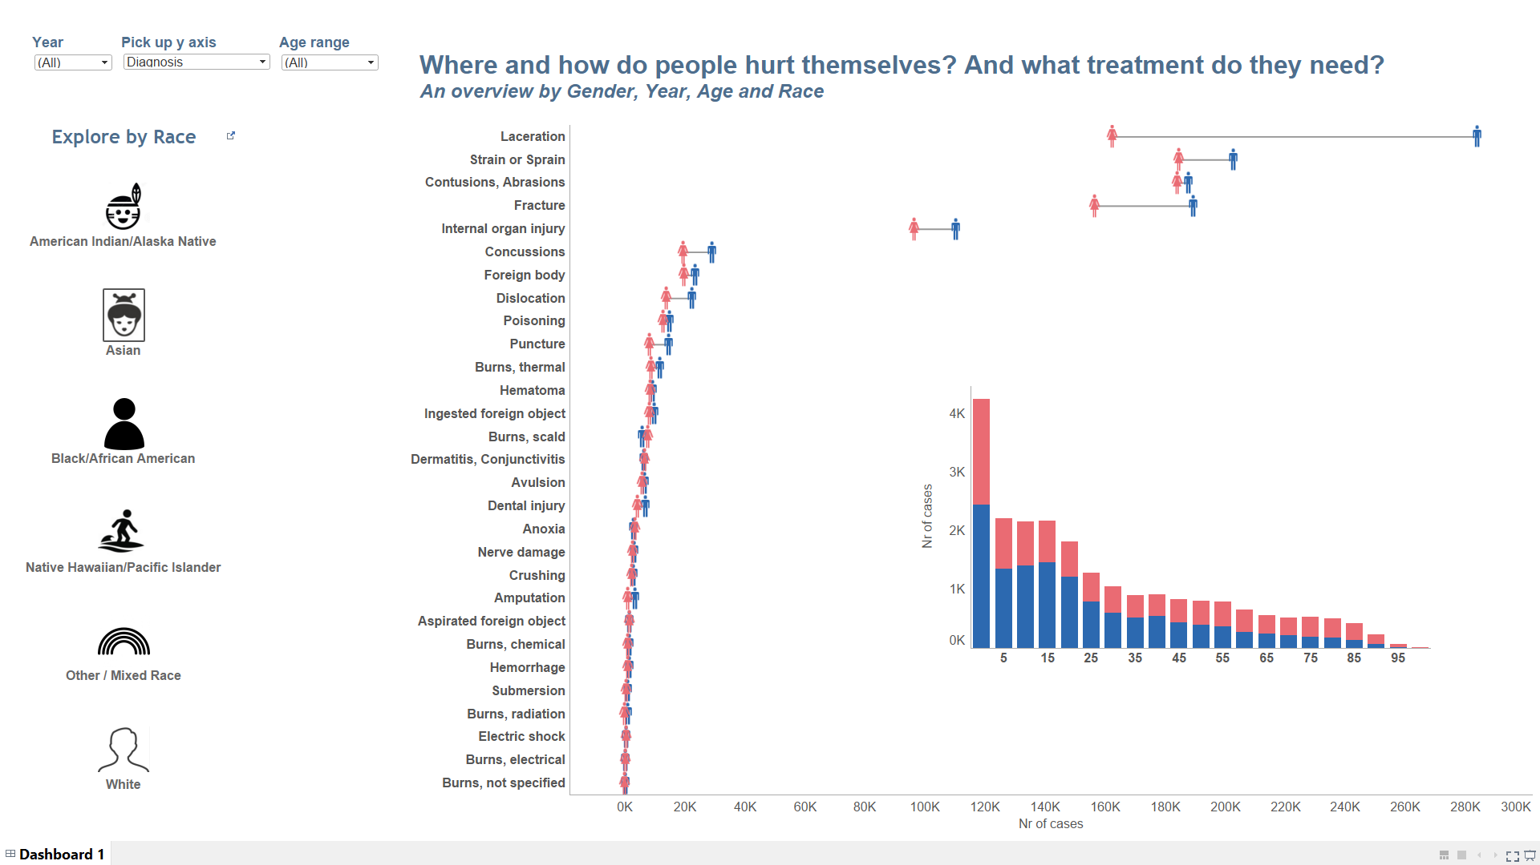
For the first viz I made during the week, I really wanted to focus on some particular features in Tableau, such as:
- parameters
- hover graphs
- filter by icons
- DNA chart
Why? Because I thought that could be a good exercise to go through some things I never used or I used only a few times.
Below there is the result of this “exercise” and the link to my Tableau public:
I hope you enjoy it!
Next blog post coming soon…