


Here I am, for my second blog post on how to filter within multiple datasource. I have explained how to use a map as filter in my previous post when you have multiple datasources.
HOW TO FILTER ON DIFFERENT CHARTS WITH A PARAMETER
Consider again Sample Superstore and Superstore Sales as datasets.
STEP 1
- Connect to Sample Superstore
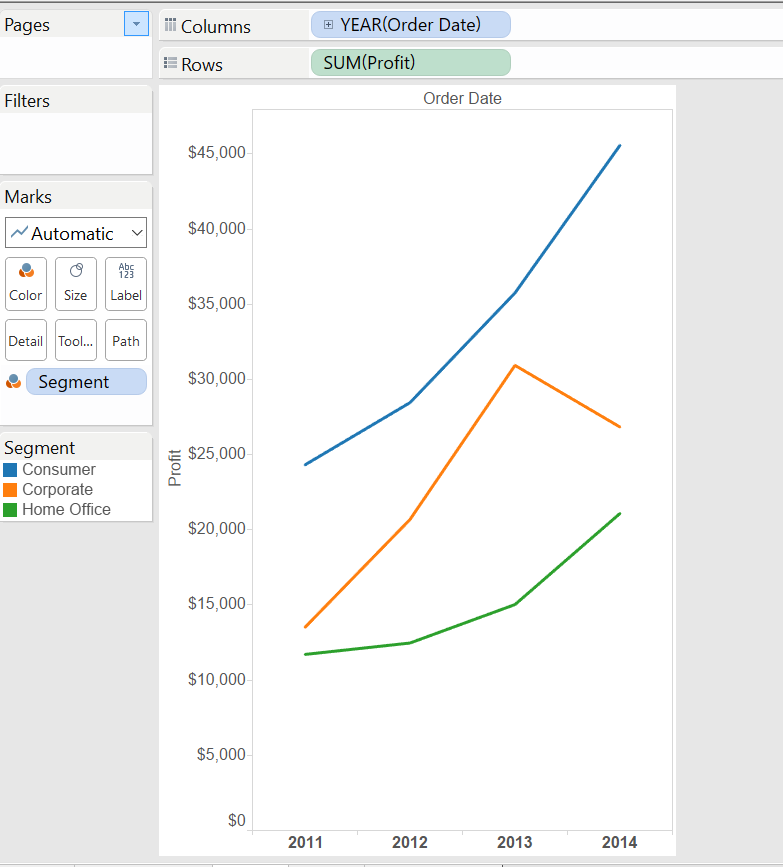
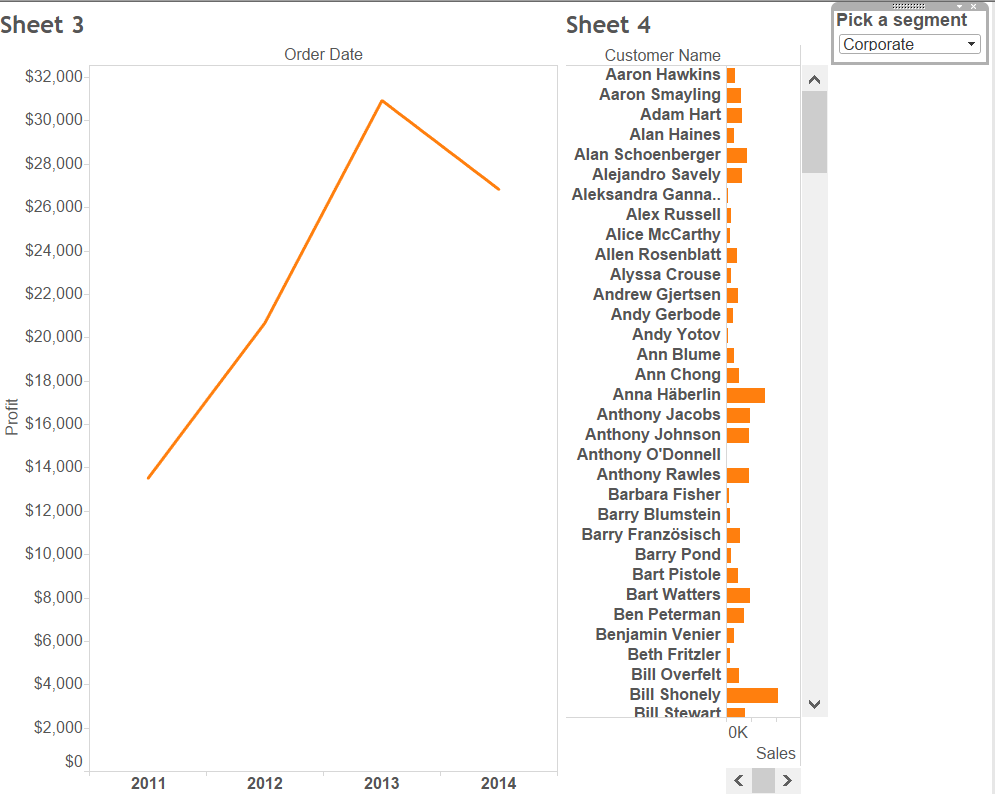
- Build a linechart dragging year on columns and SUM(profit) on rows
- Put Segment on colour
STEP 2
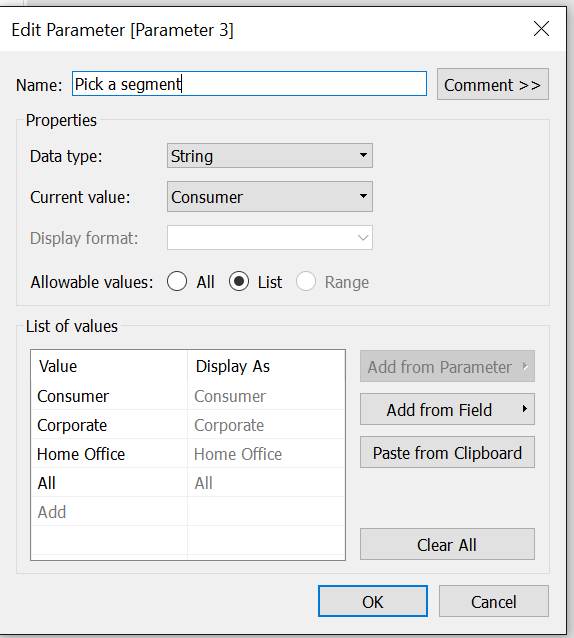
- Create a string parameter, select List and “Add from field”, selecting Segment, then add manually “All” (in order to let it show all the values), as below:
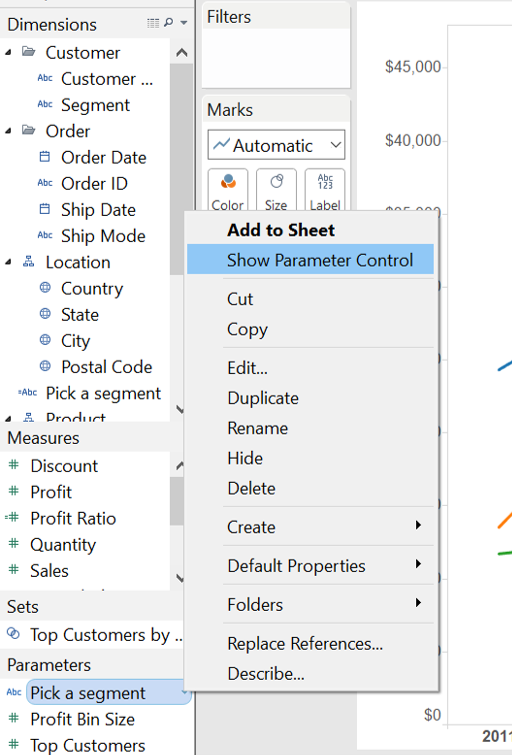
- Show the parameter in the view selecting the option “Show parameter control”, as below:
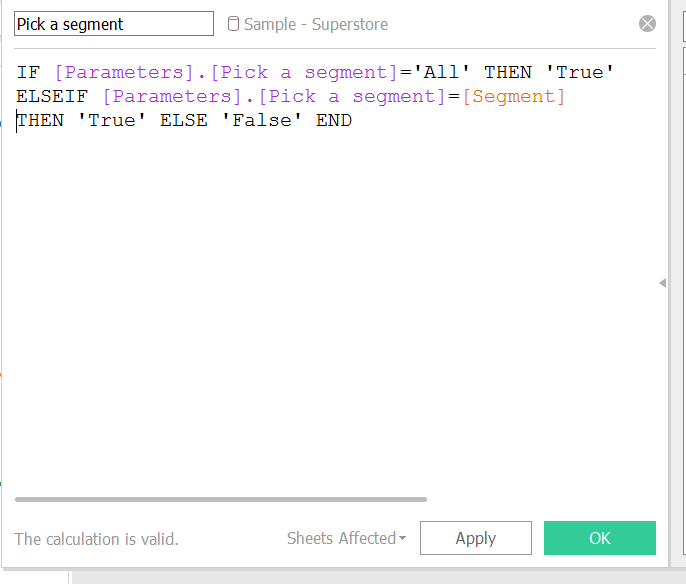
- Now, you will have the parameter in your view, but you need to create a calculated field to let it work. So, create a calculated field as below:
- Drag the calculated field to Filter and select “True”
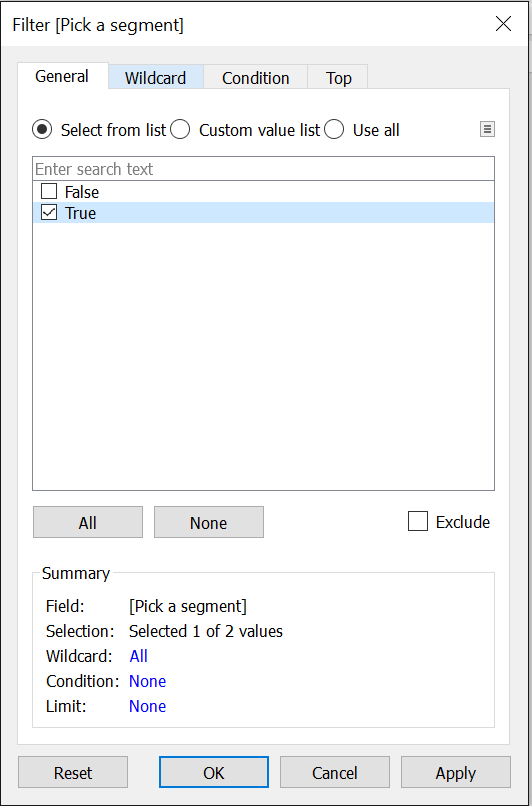
- Test your filter in this view
STEP 3
- Now, create a new worksheet and connect to Superstore Sales and blend it with the previous datasource (for example blend them on segment)
- Create a view with a bar chart of customer names and sum(sales) and drag segment (from sample superstore) on colour
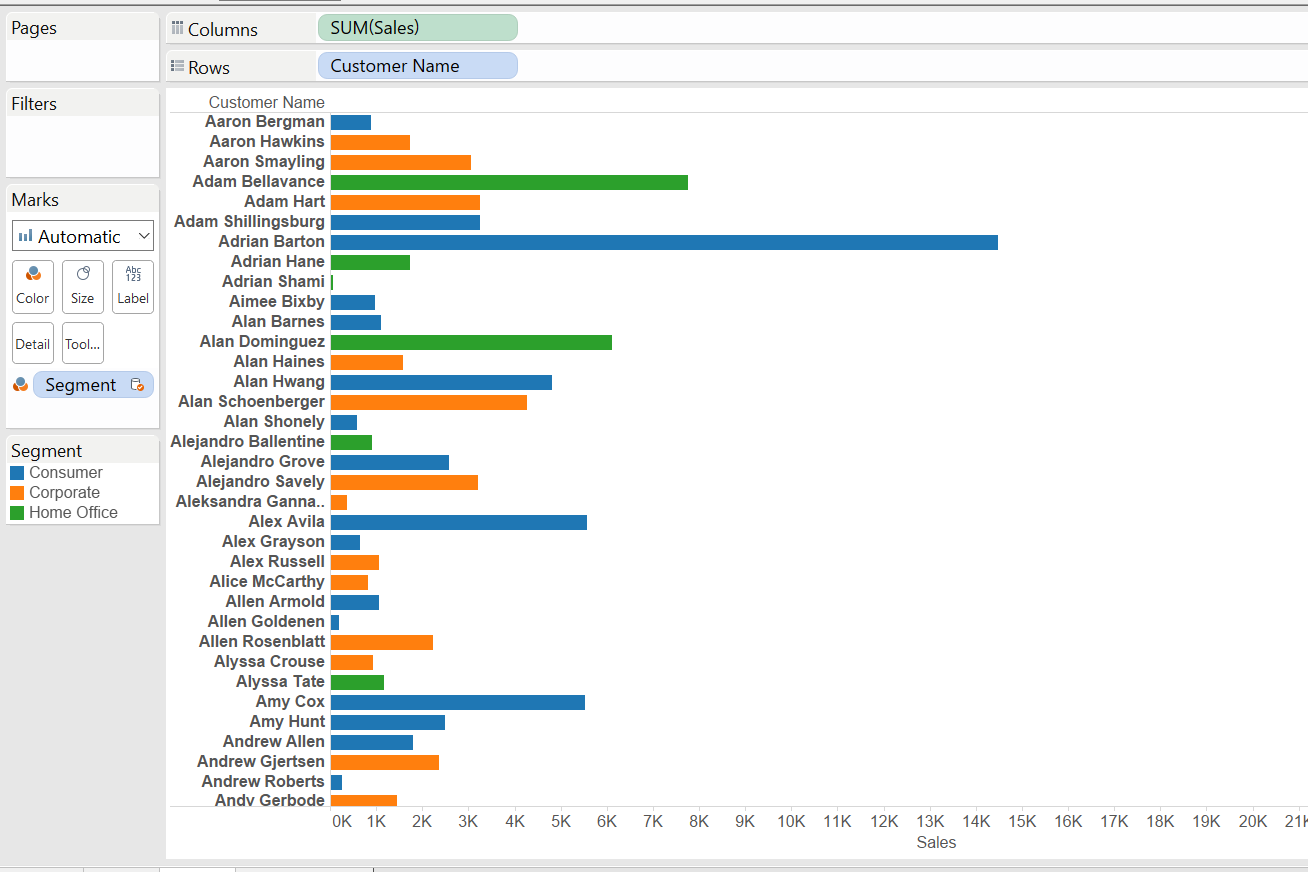
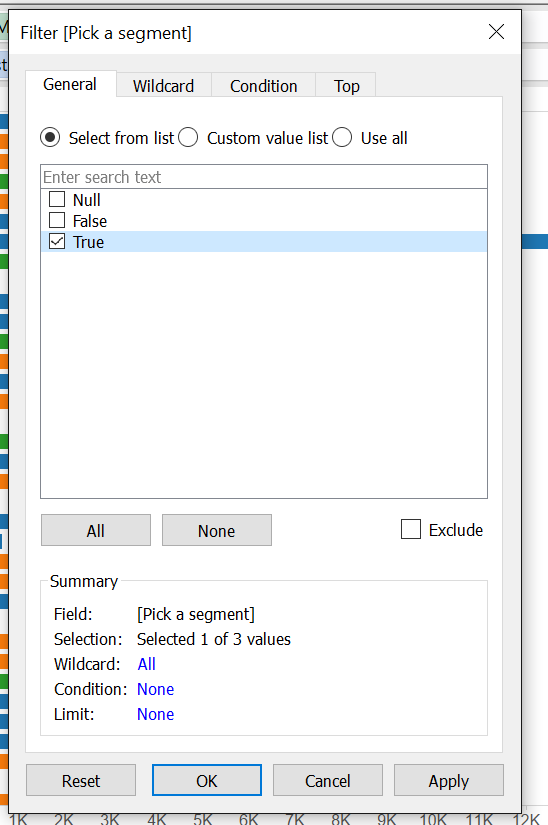
- Drag the calculated field of the parameter (Pick a segment) in Filter and select “True”:
STEP 4
- Build a dashboard and drag the two charts in the view and show the parameter in the dashboard
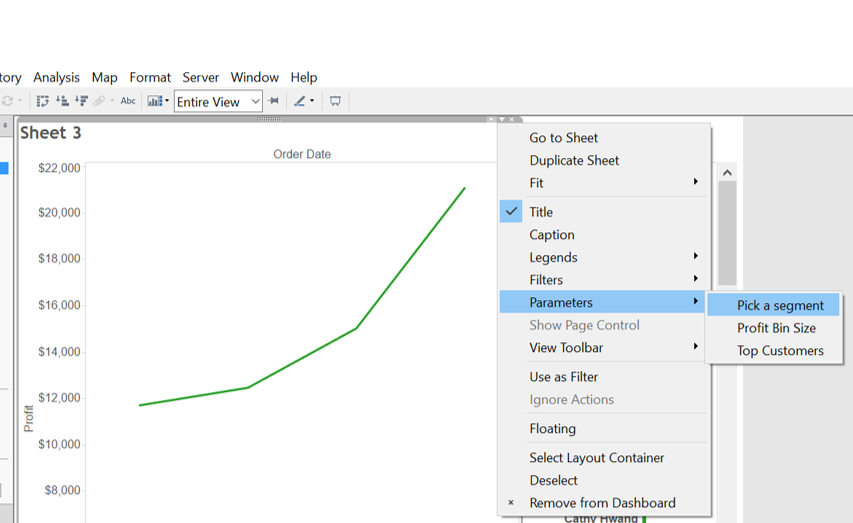
- Try the filter and you will see it will work!
I hope you find it useful.
A presto!